Infographics for University of Oxford
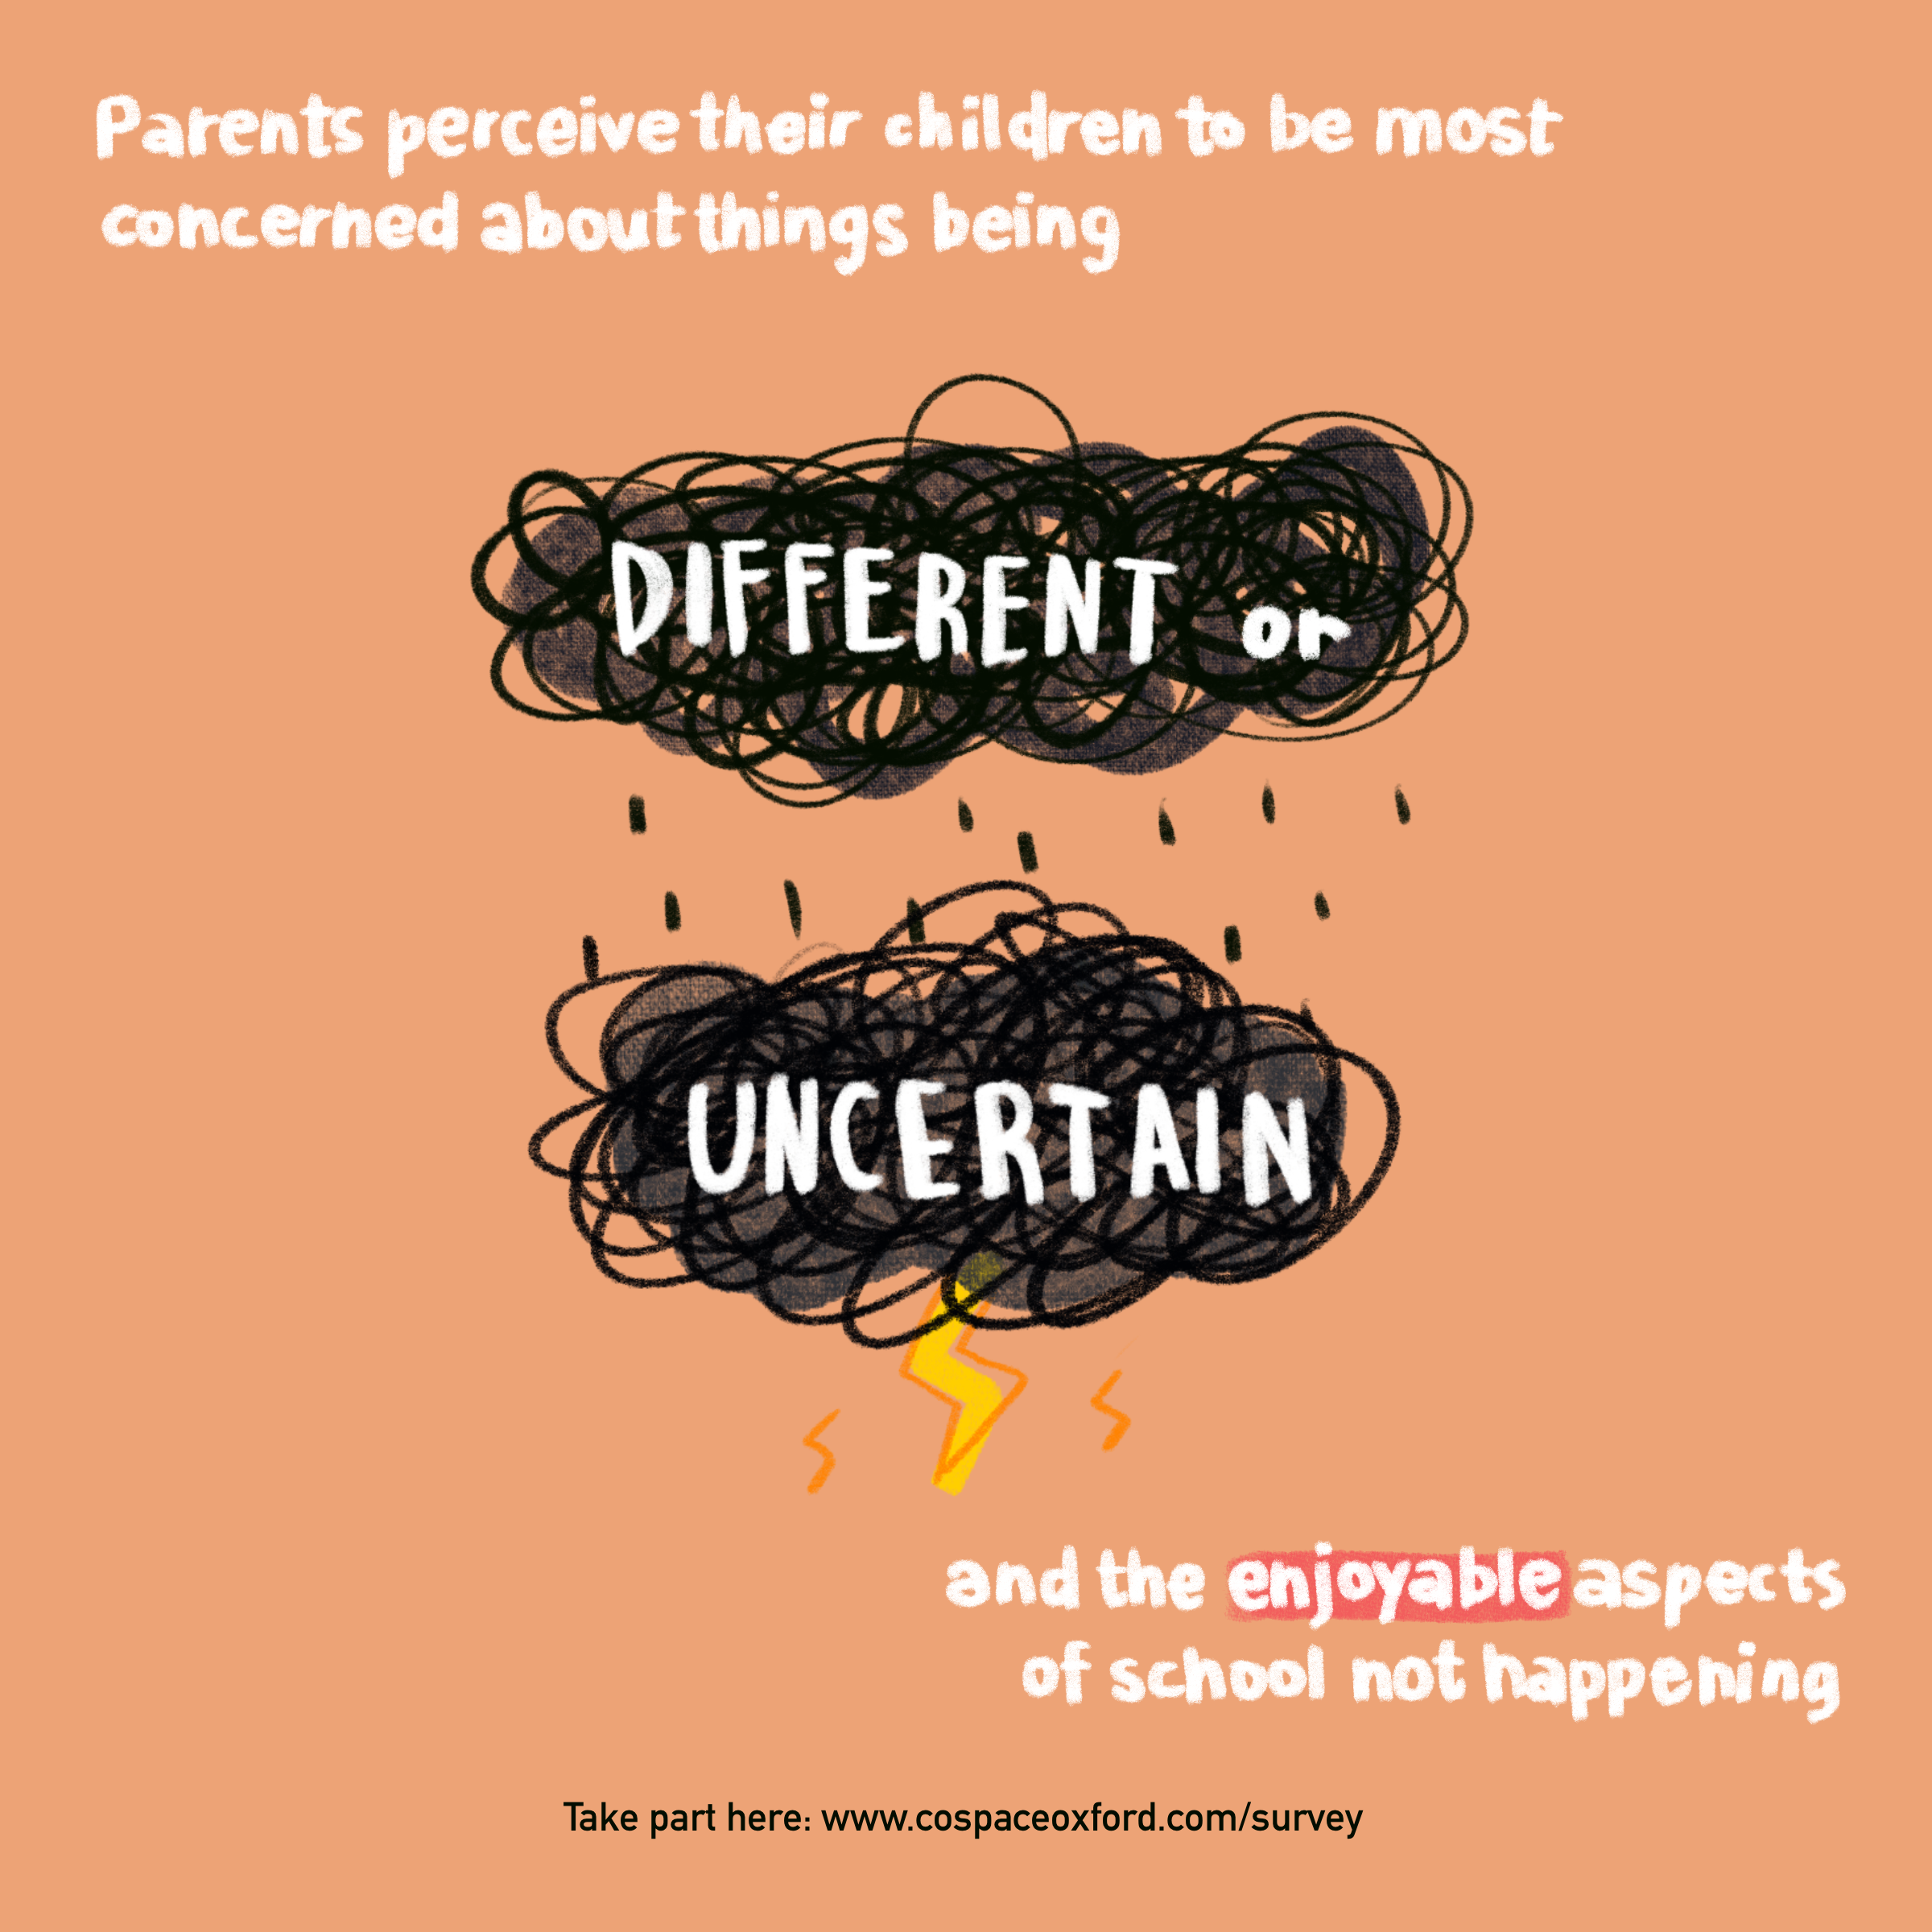
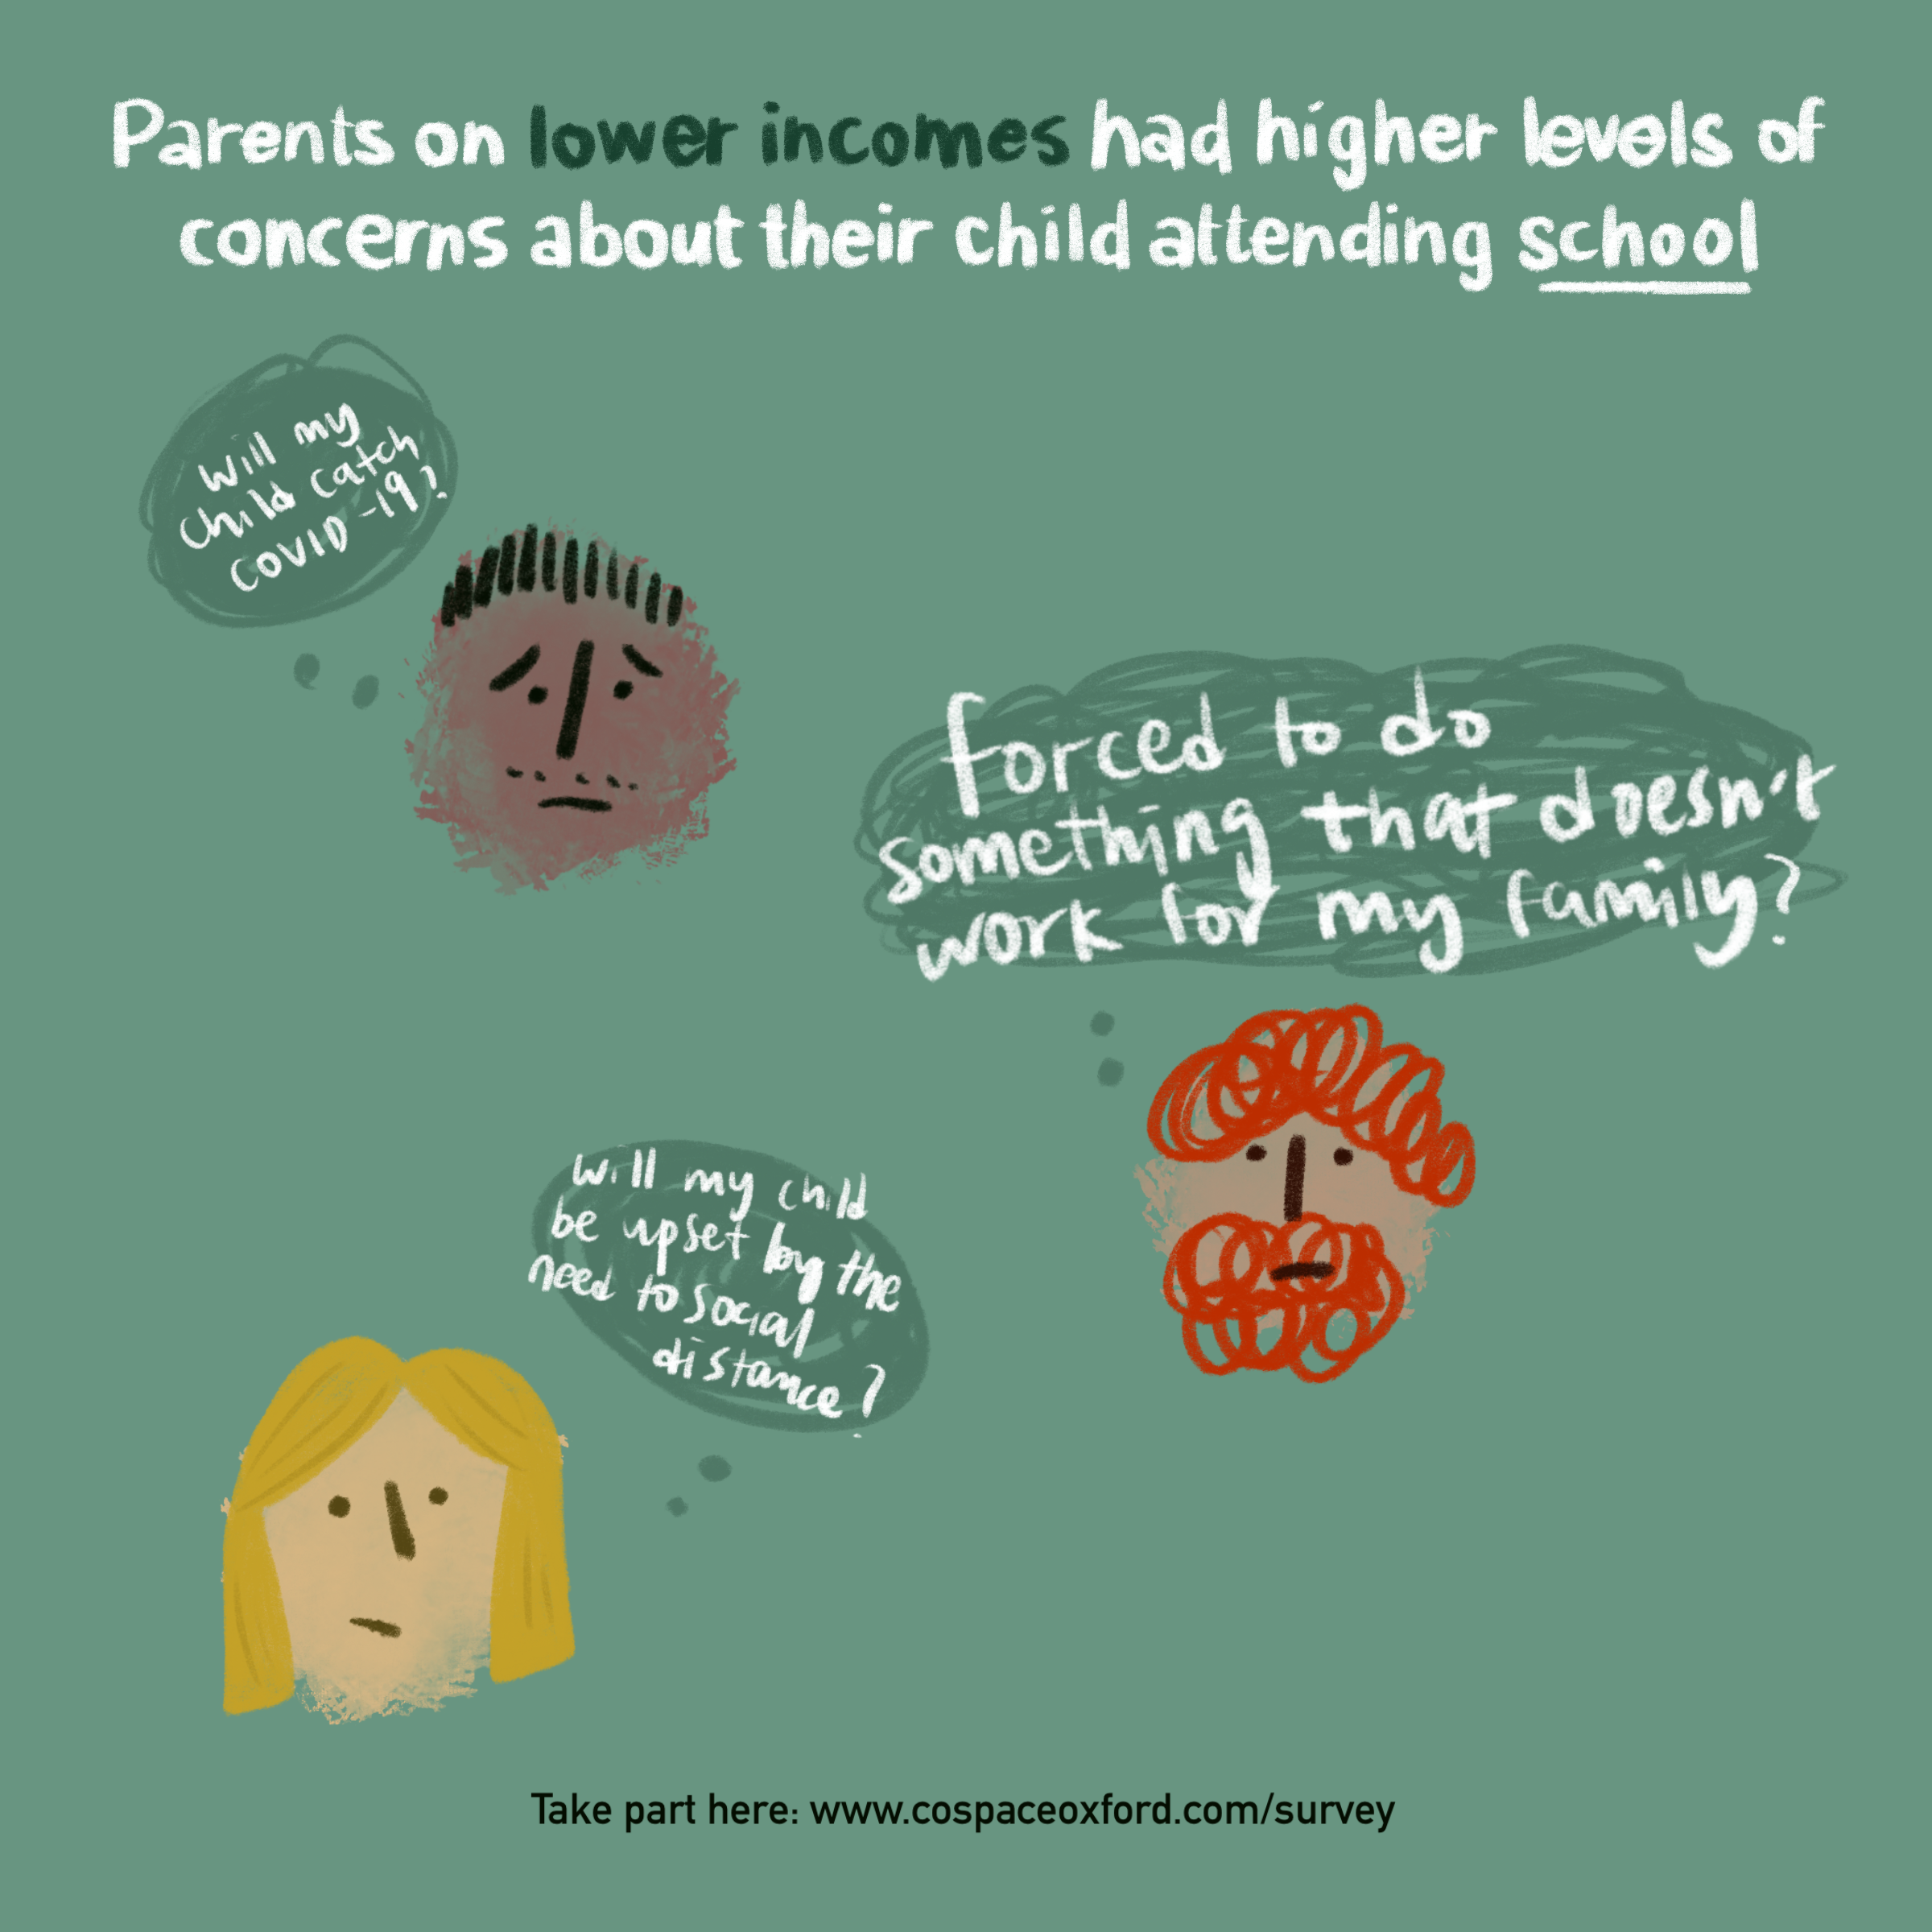
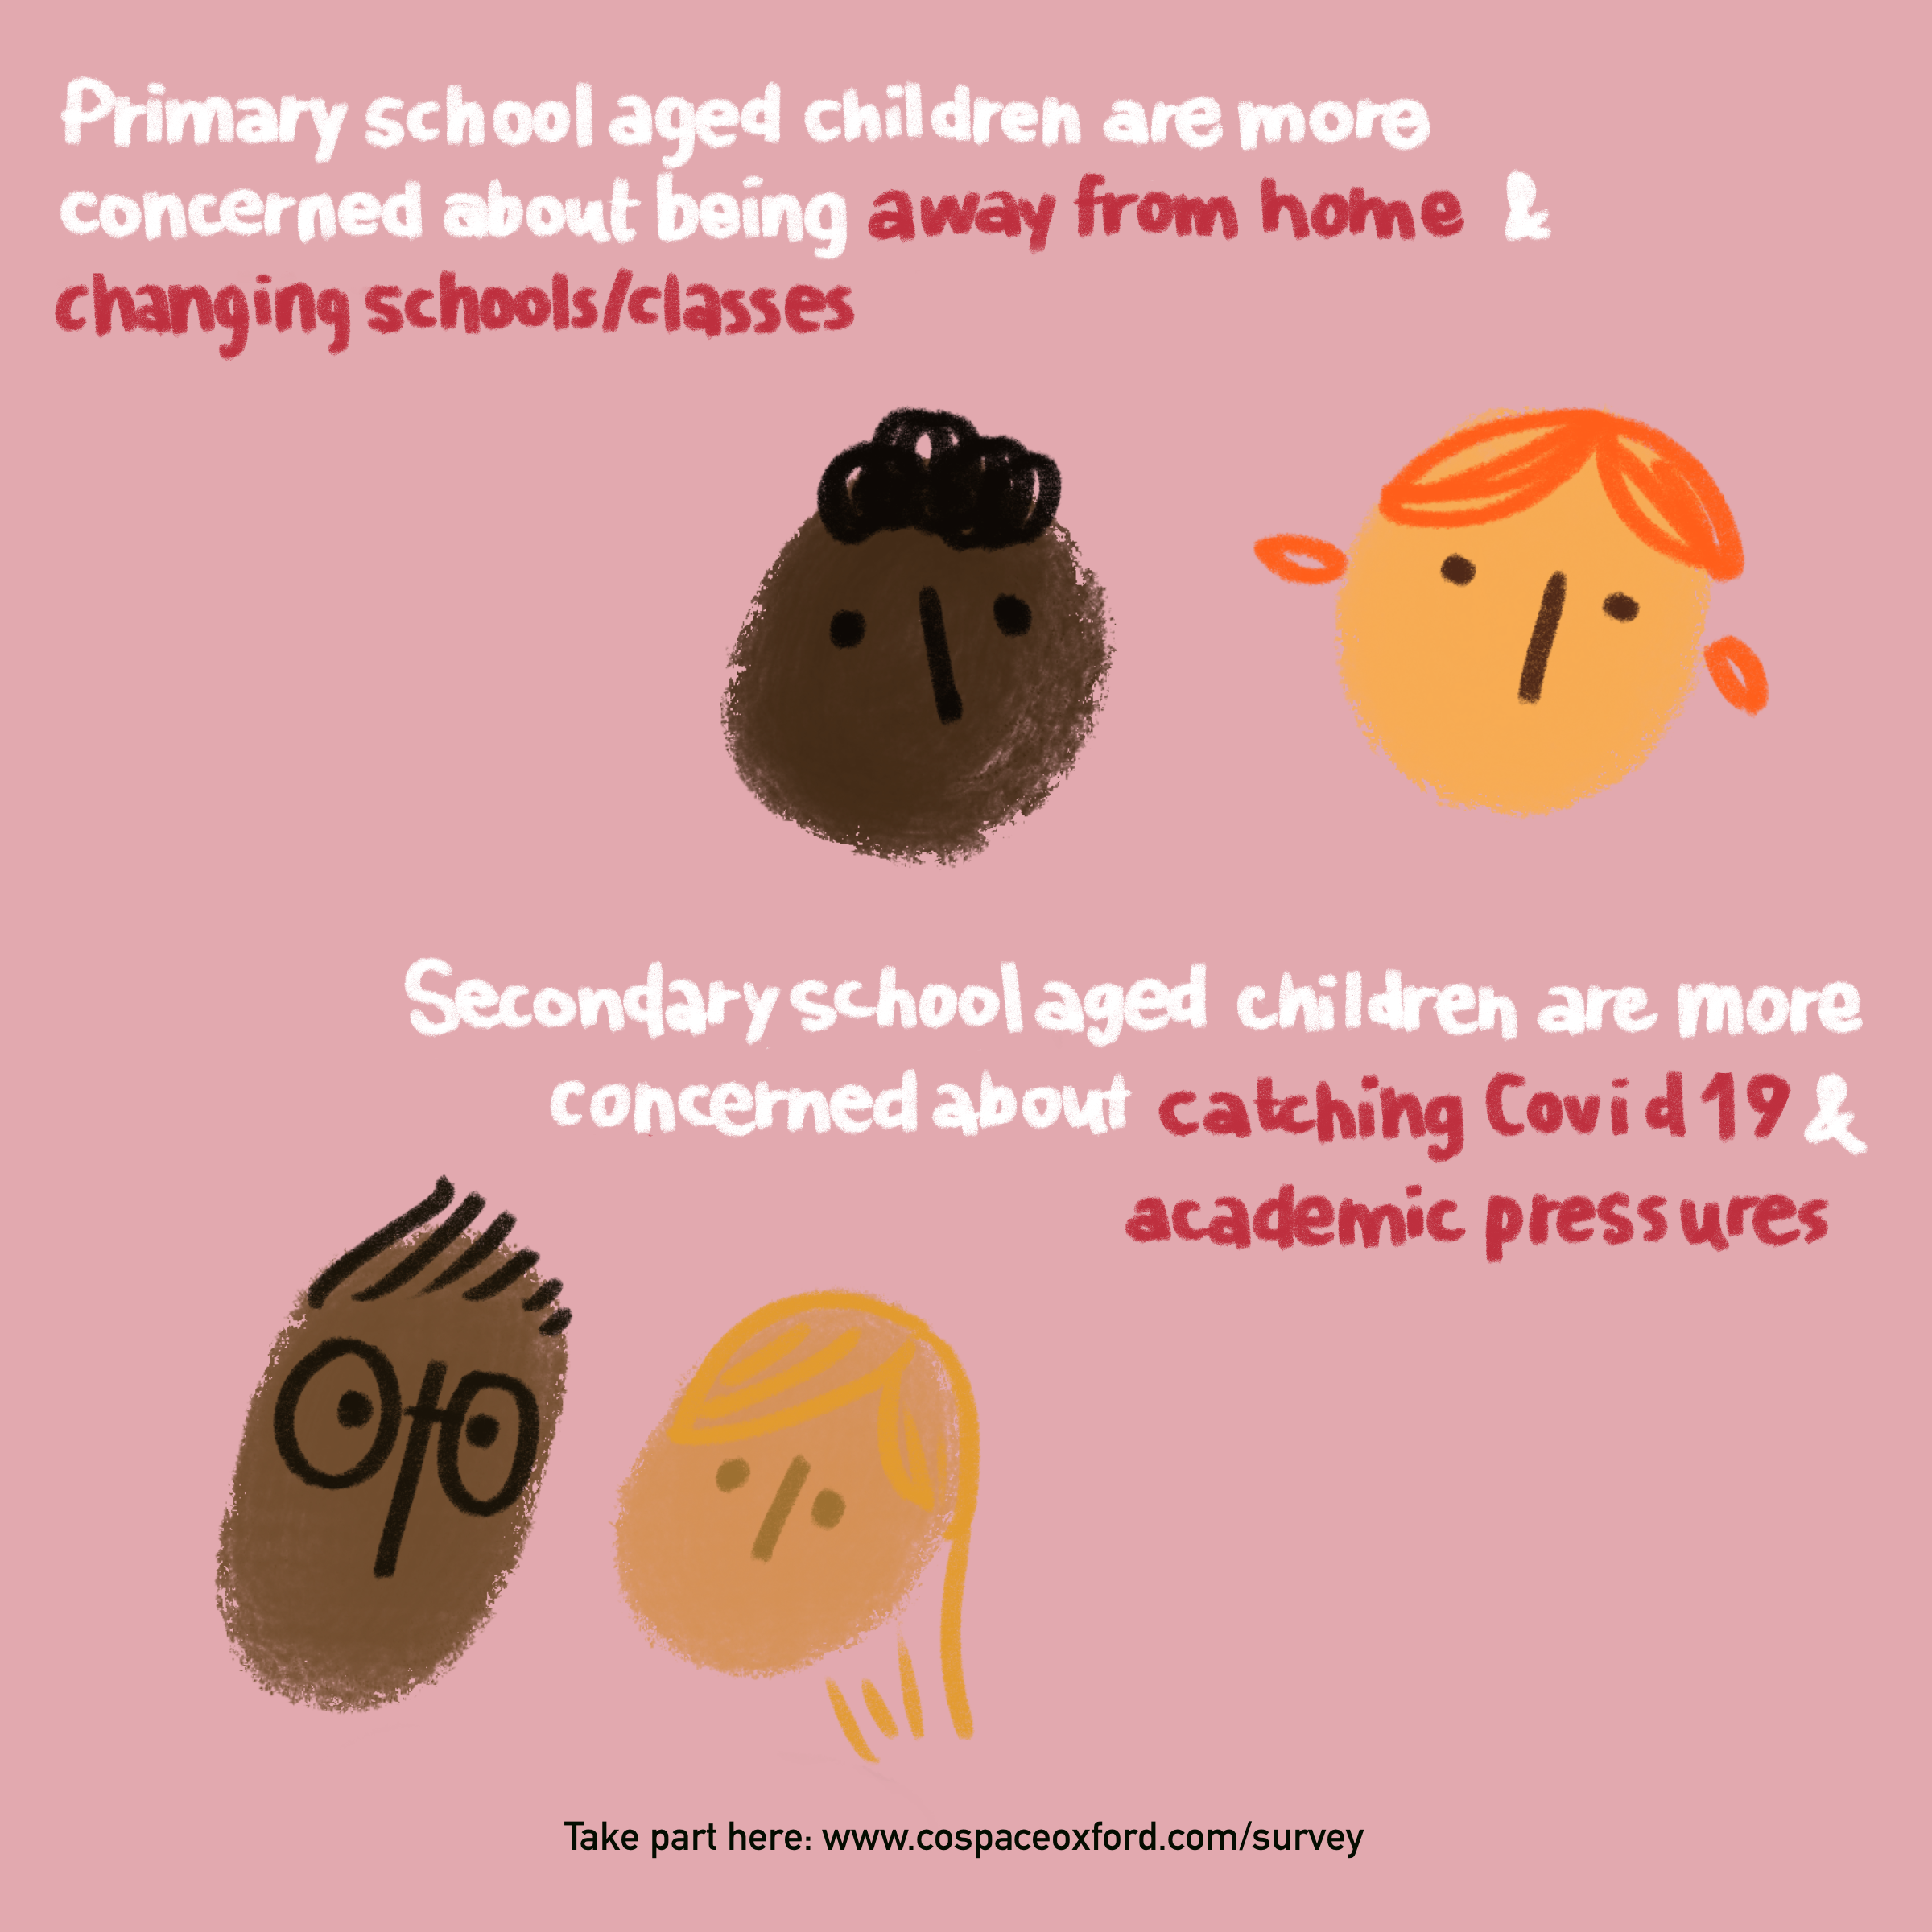
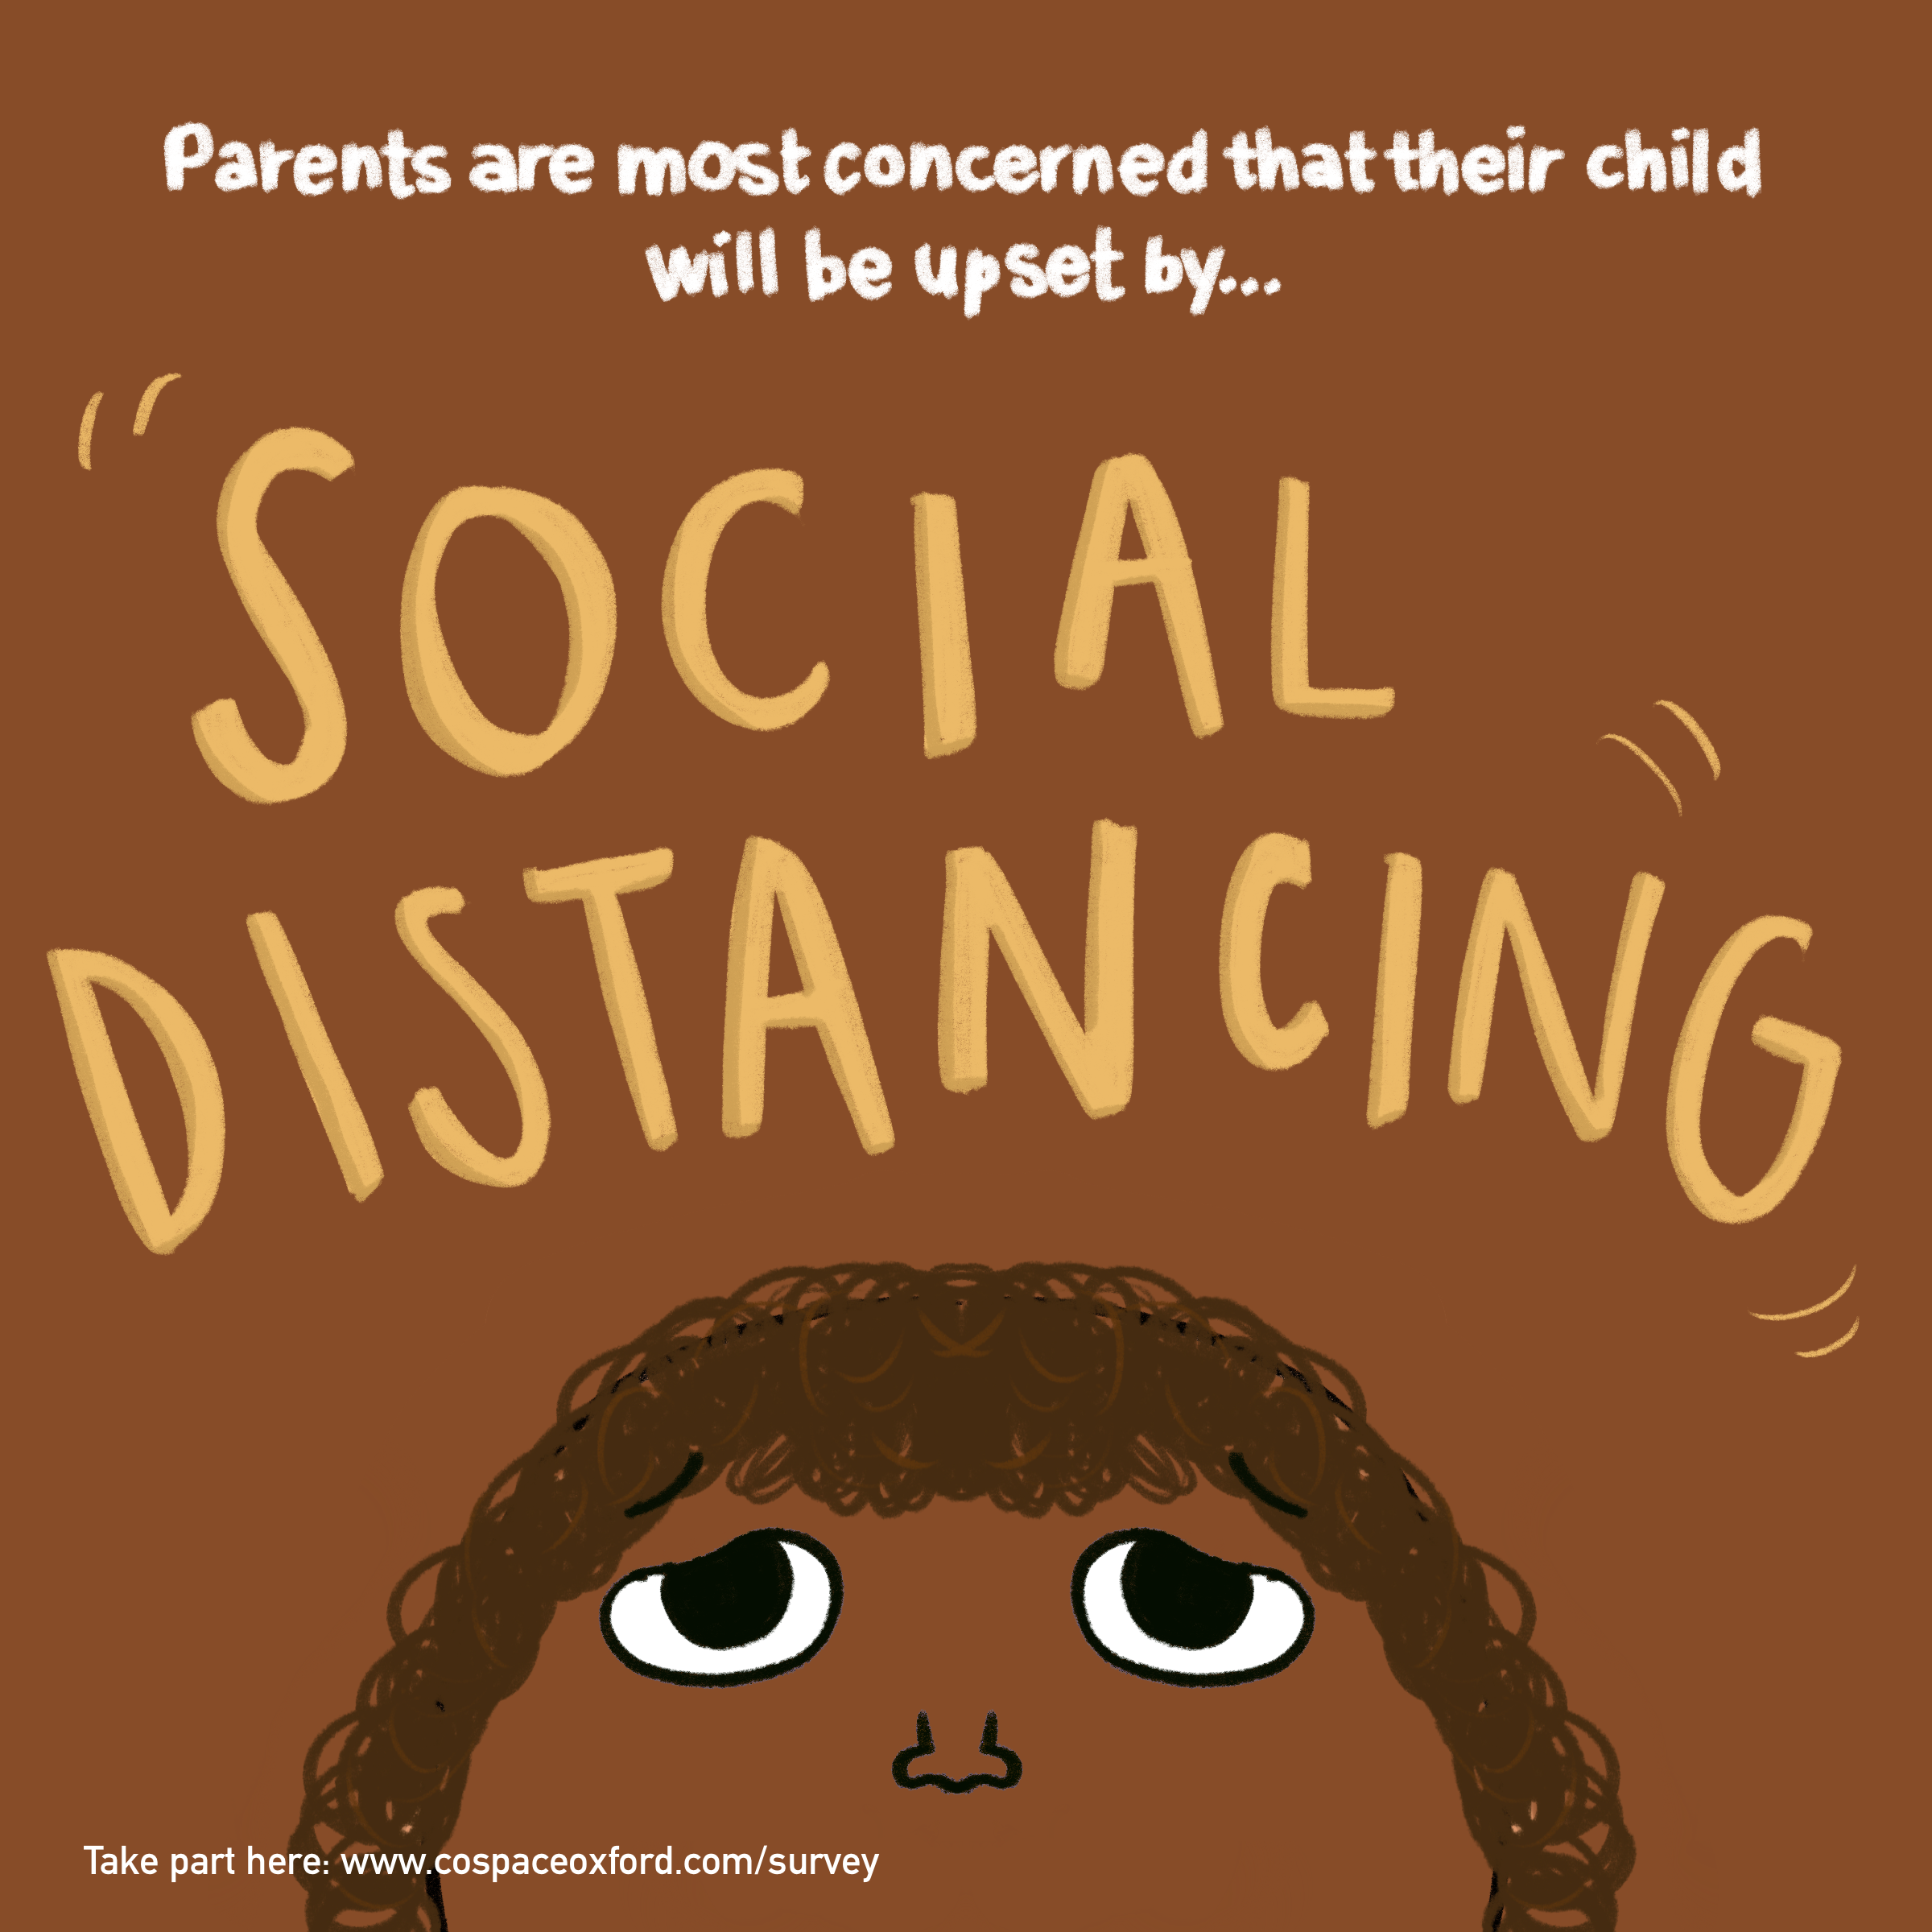
I spent two years as a researcher at a mental health lab at University of Oxford. During my time there, I used infographics and data visualisations to better communicate our findings and extend the reach of our research. Hence, my illustrations have been presented in conferences, on national television and in The Lancet.
Here are a few things I'm good at:
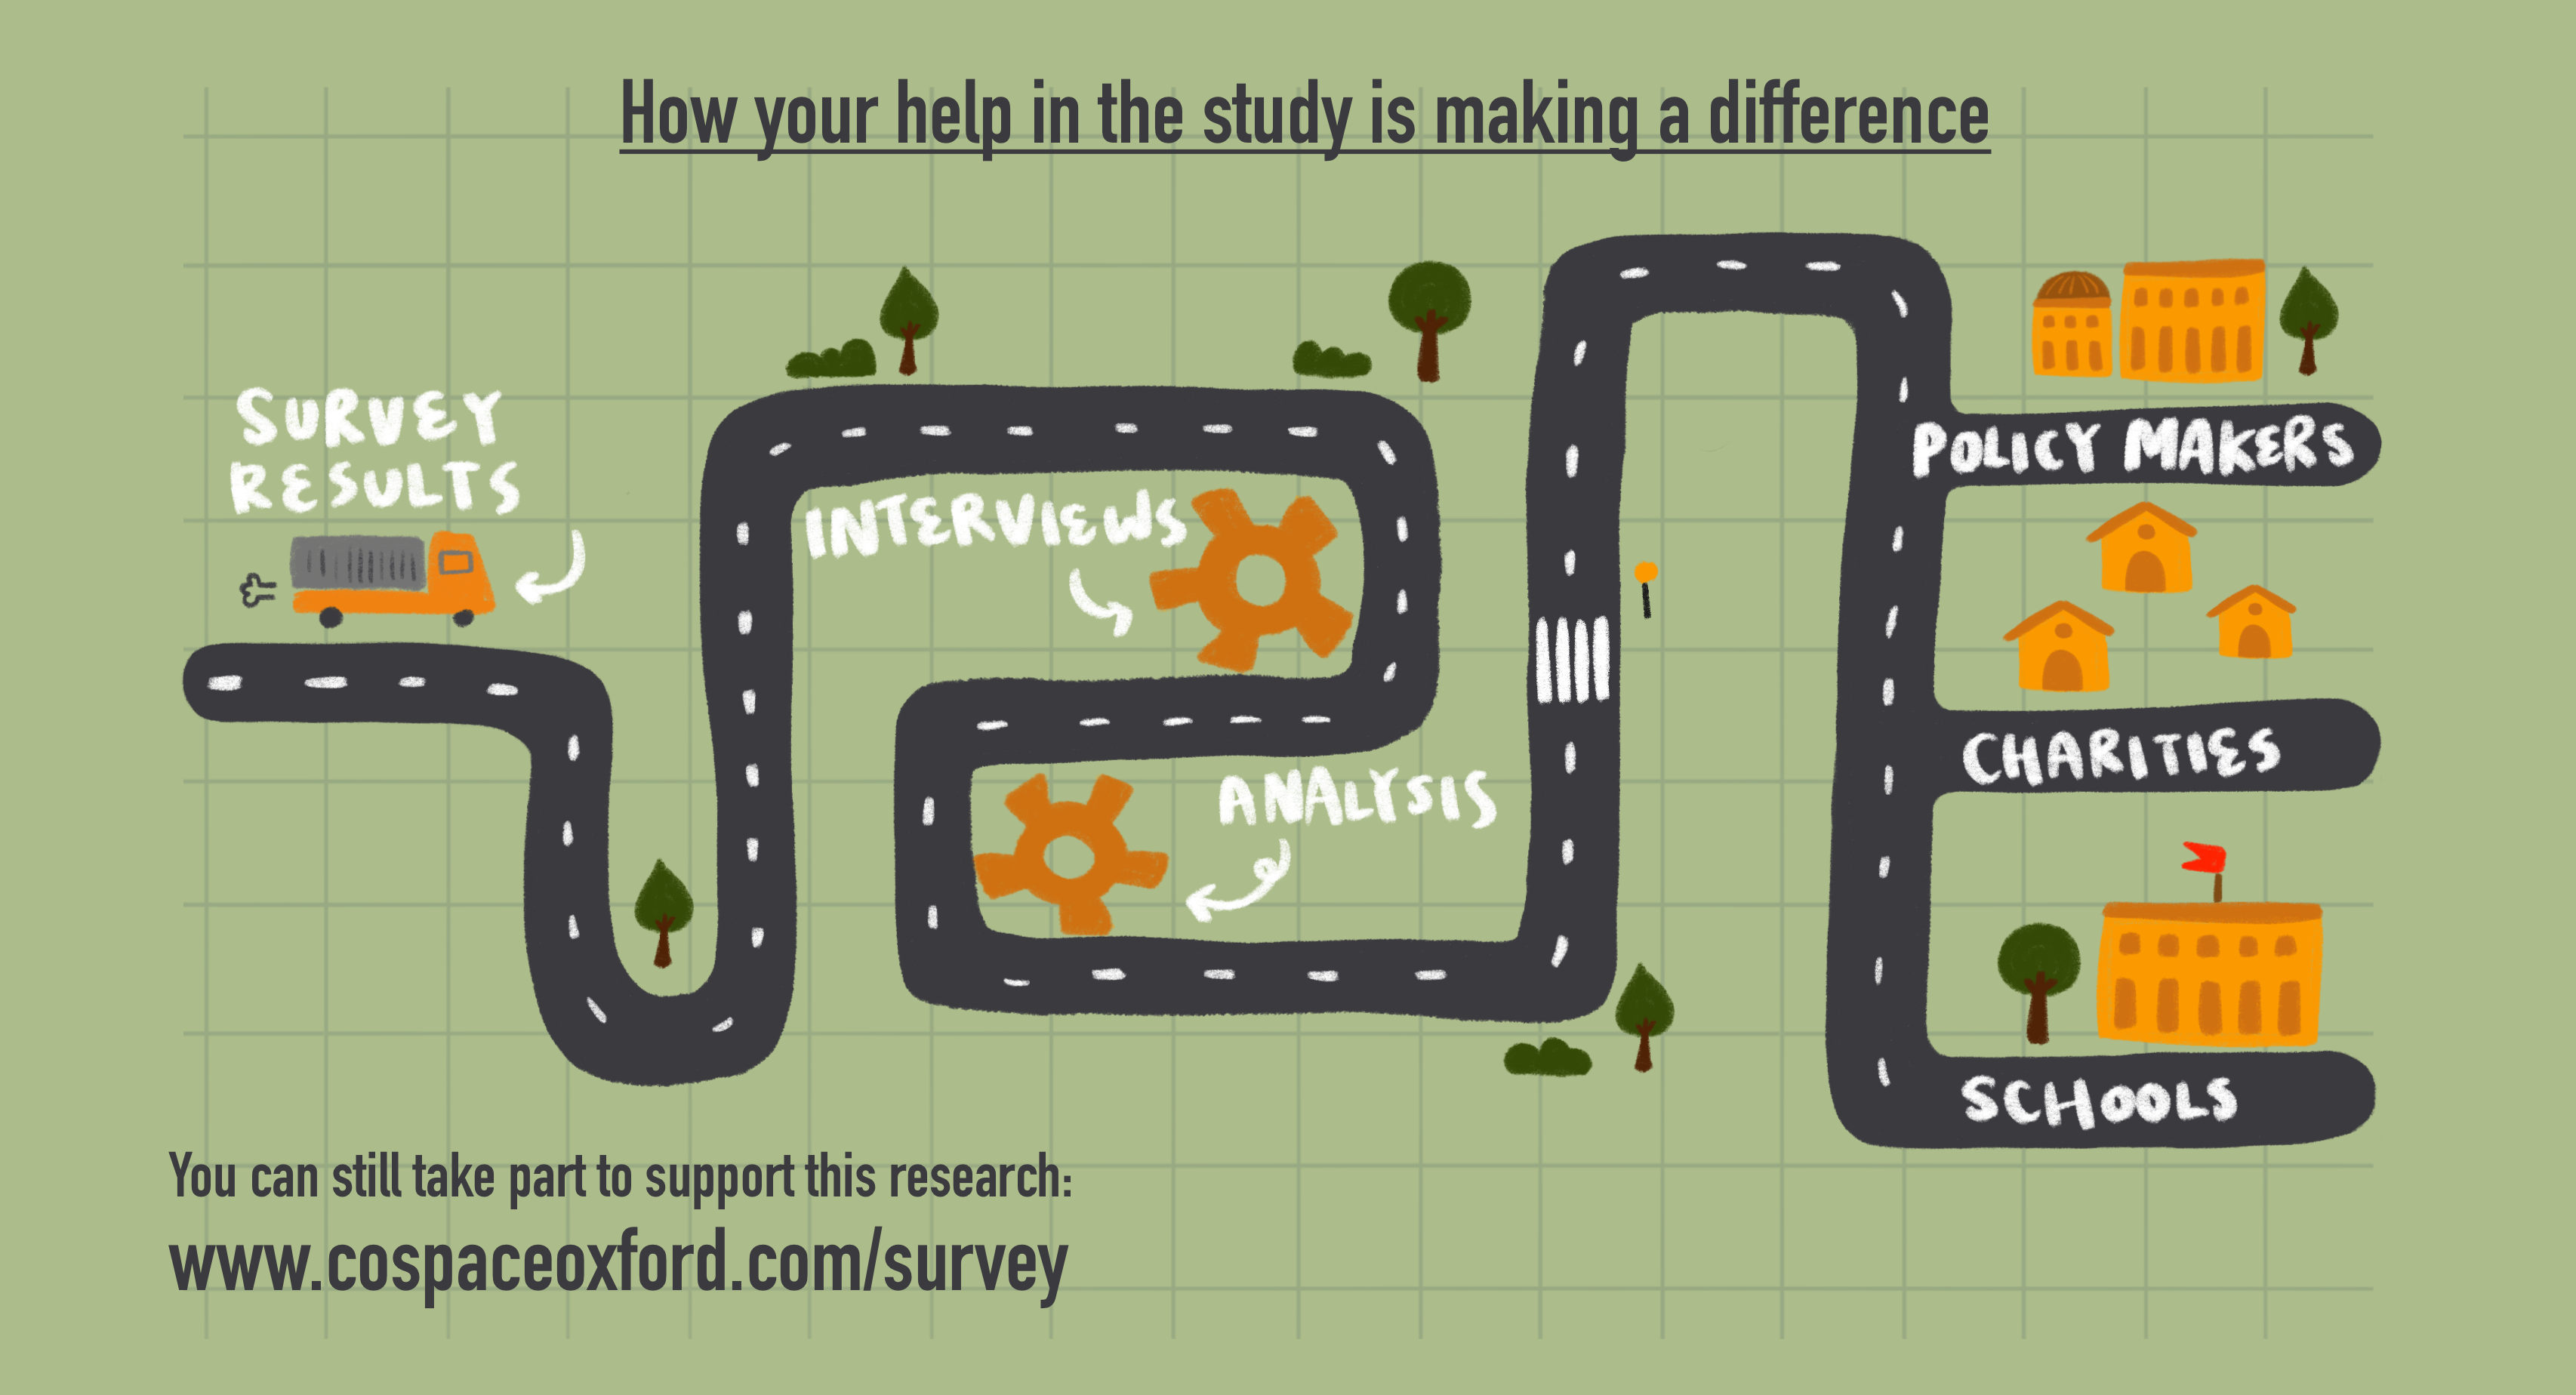
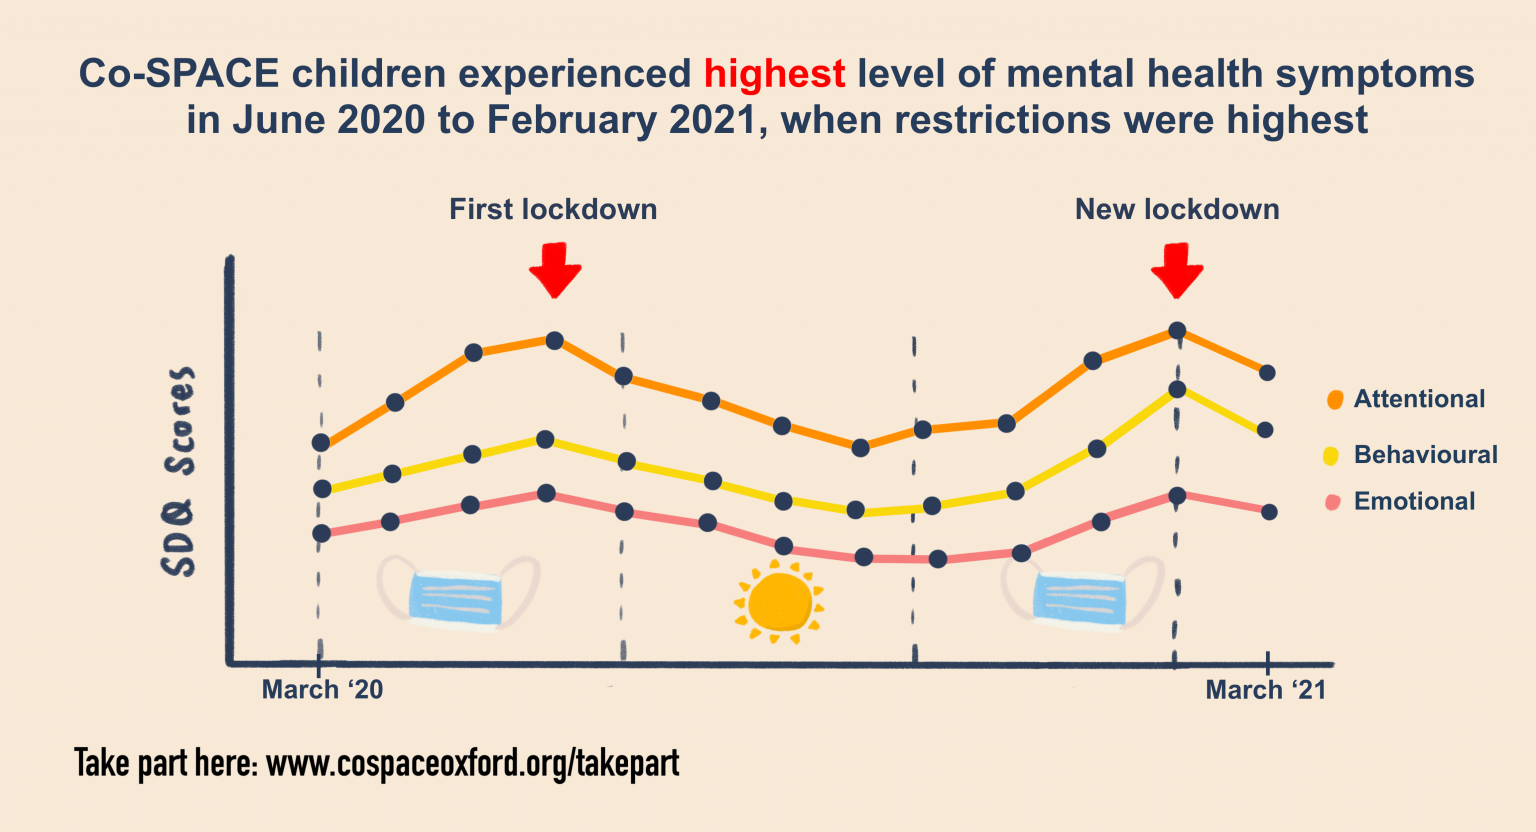
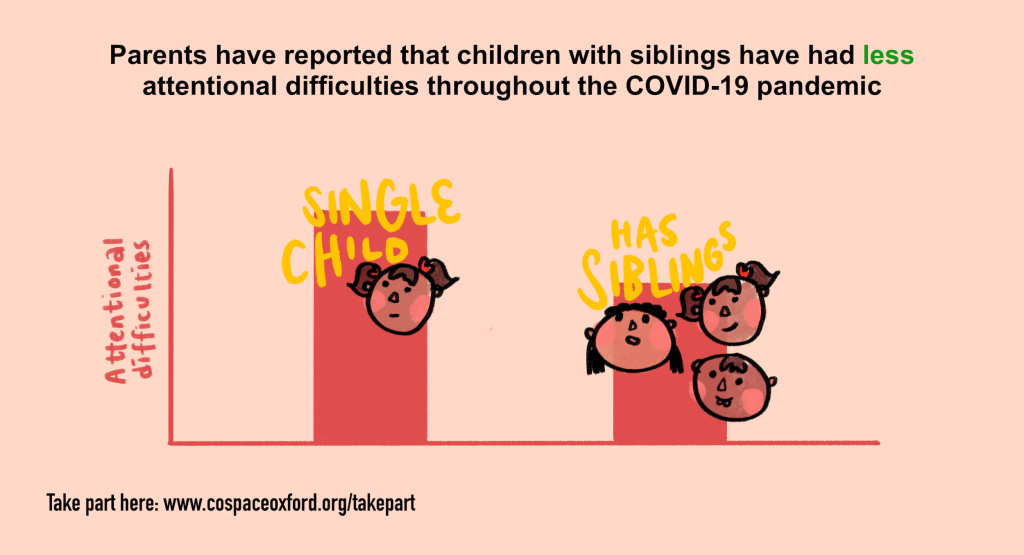
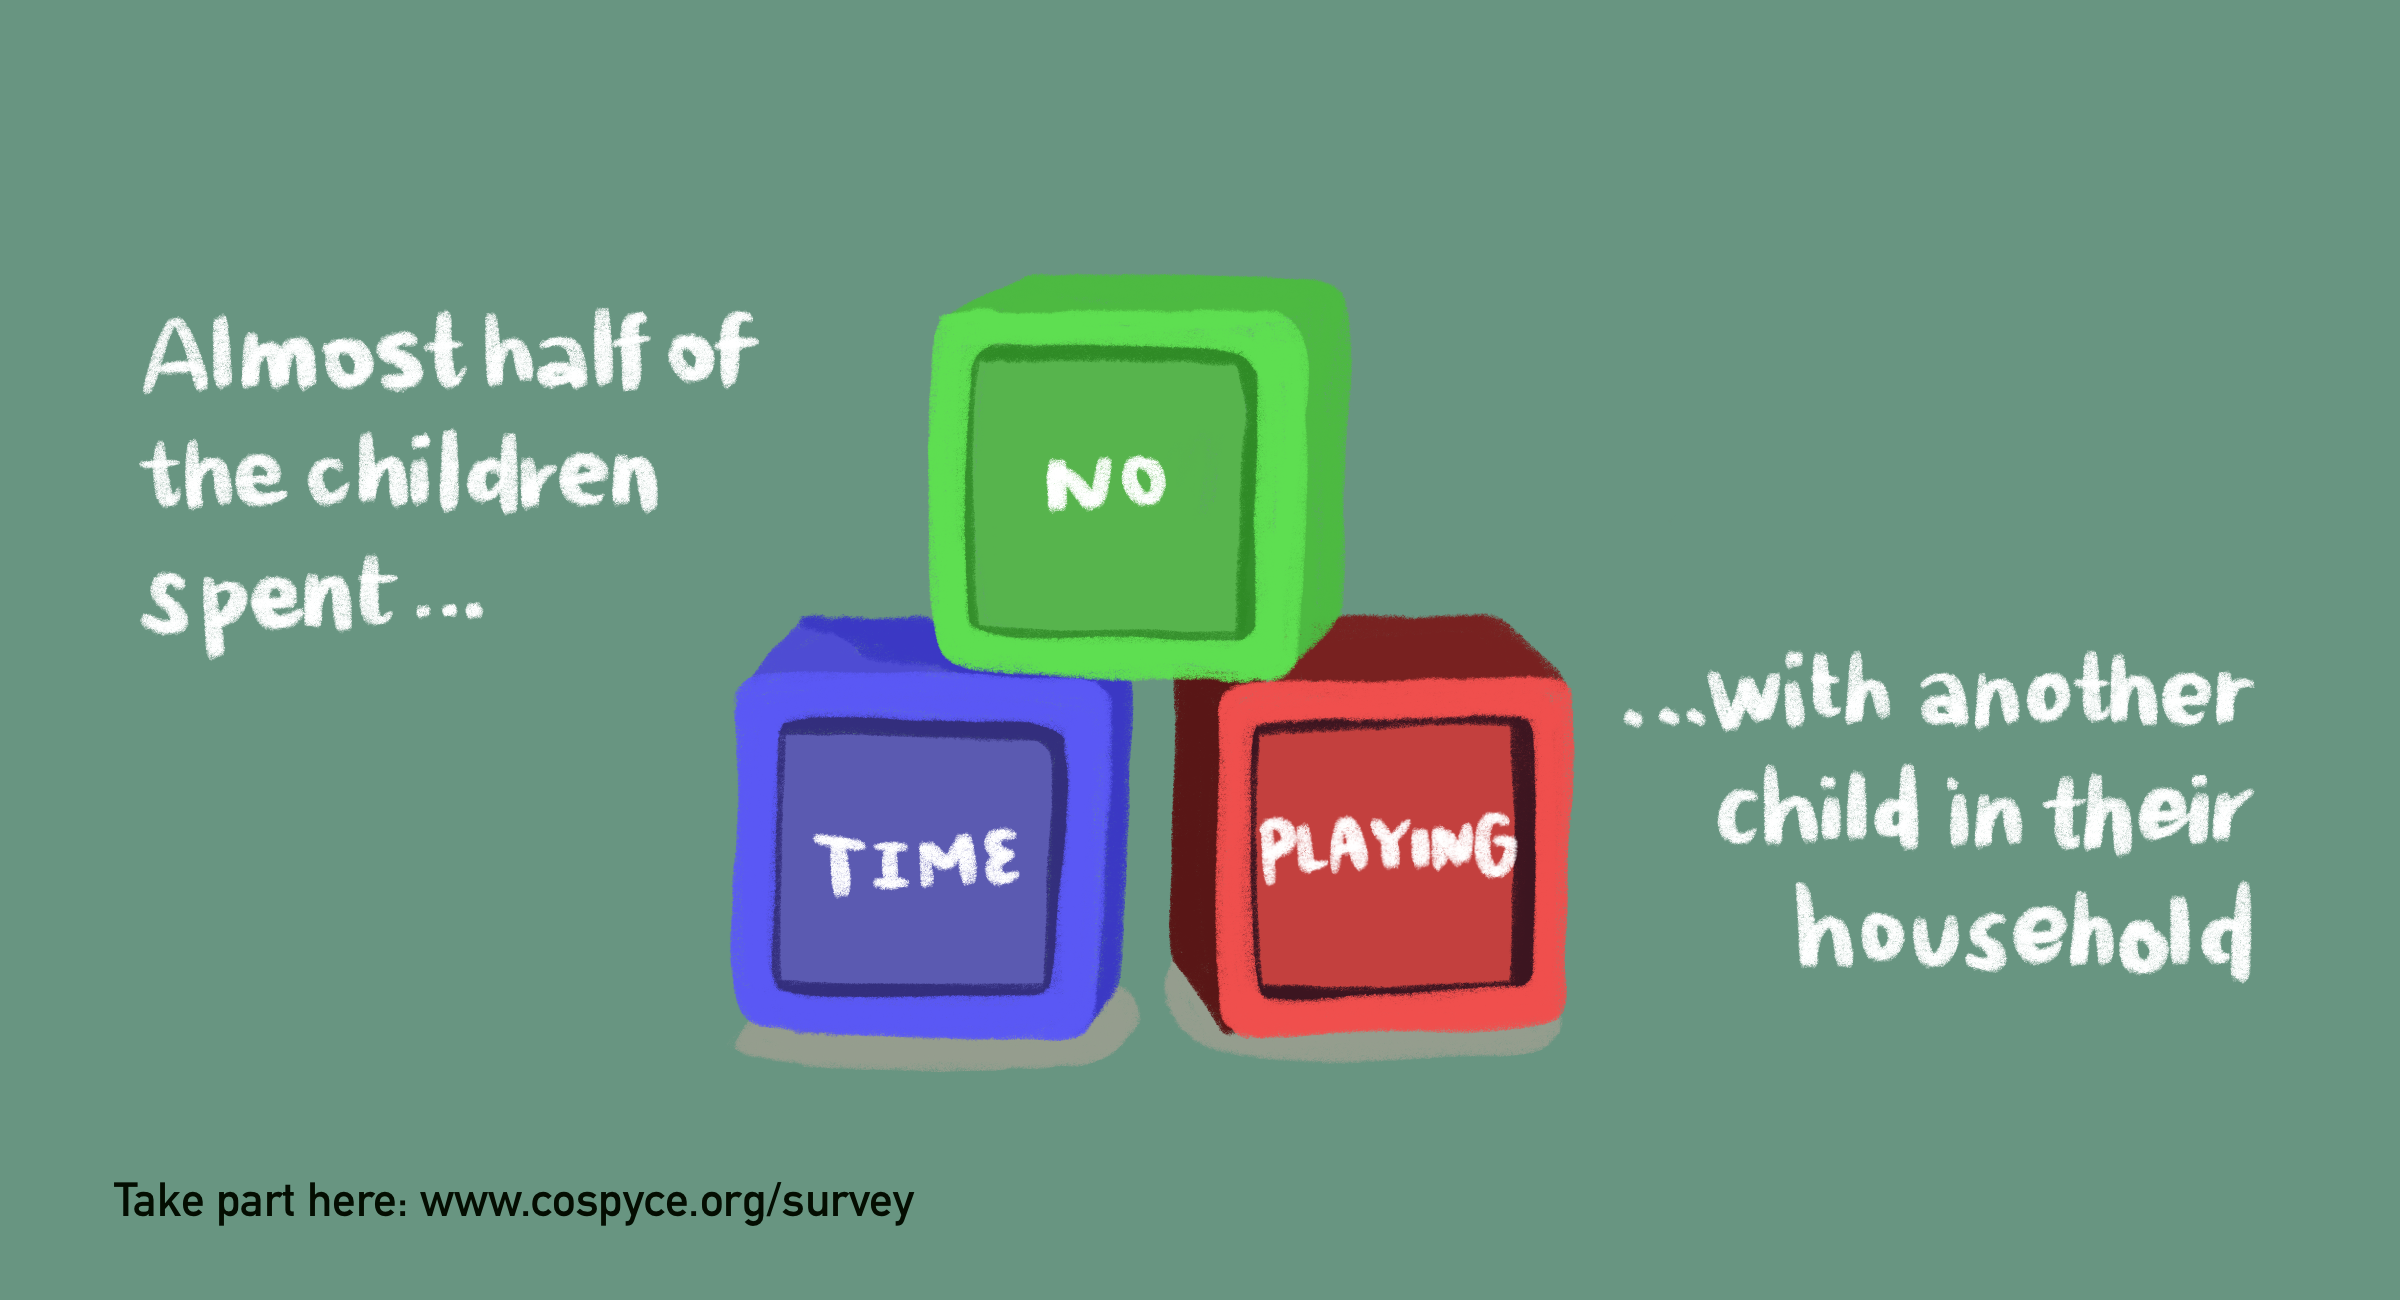
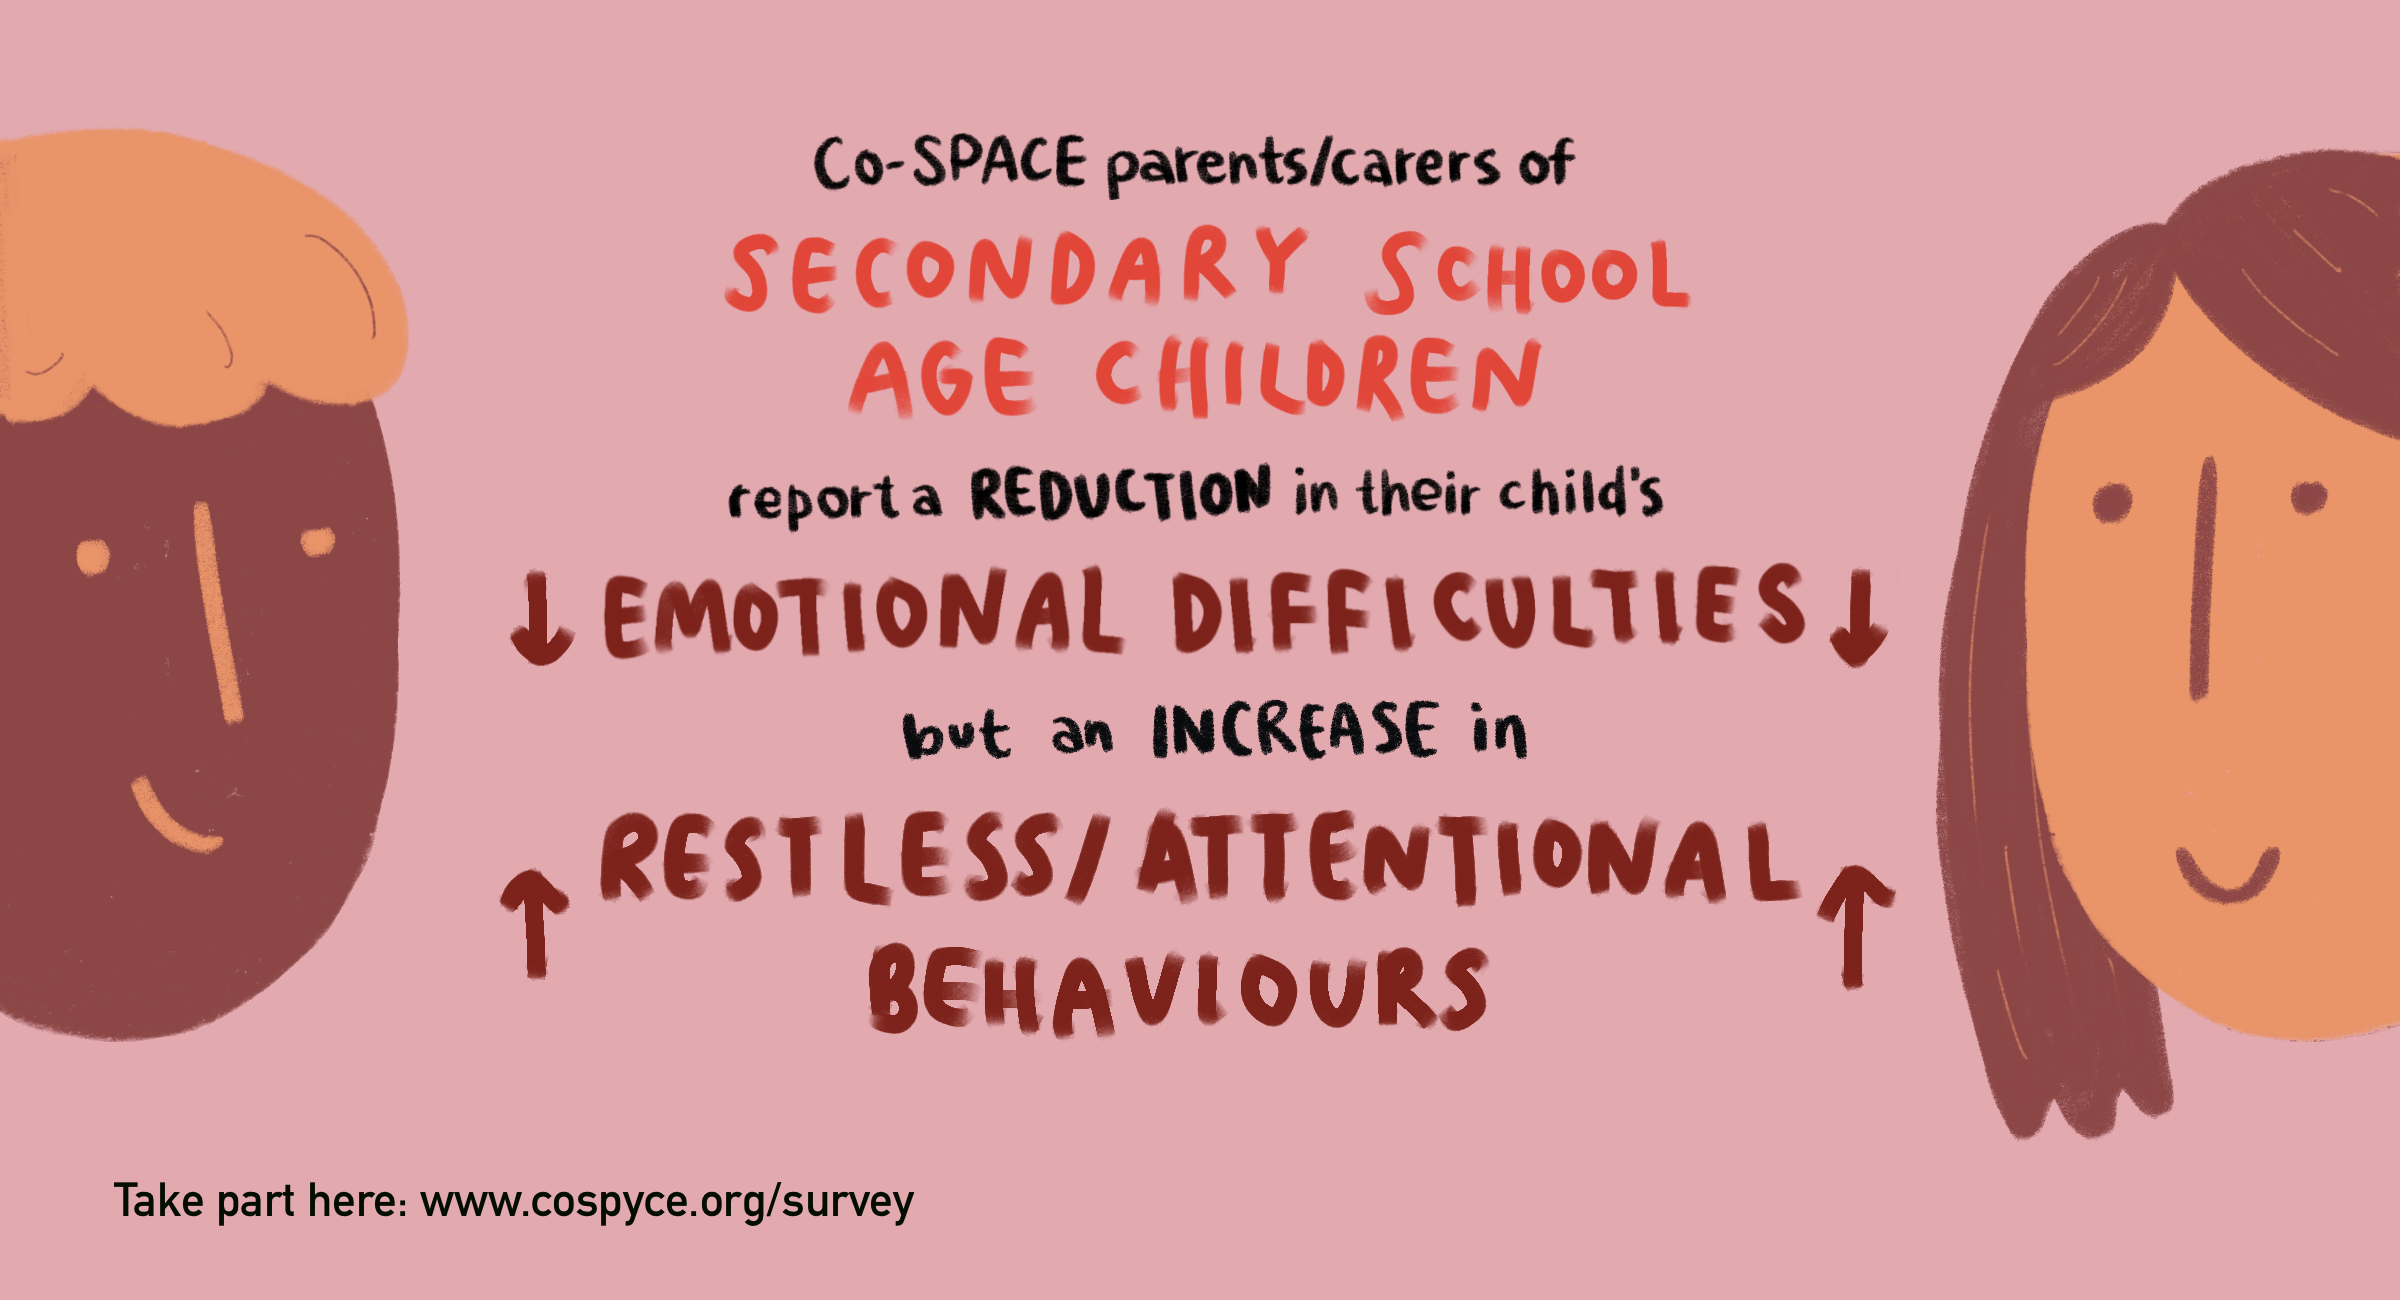
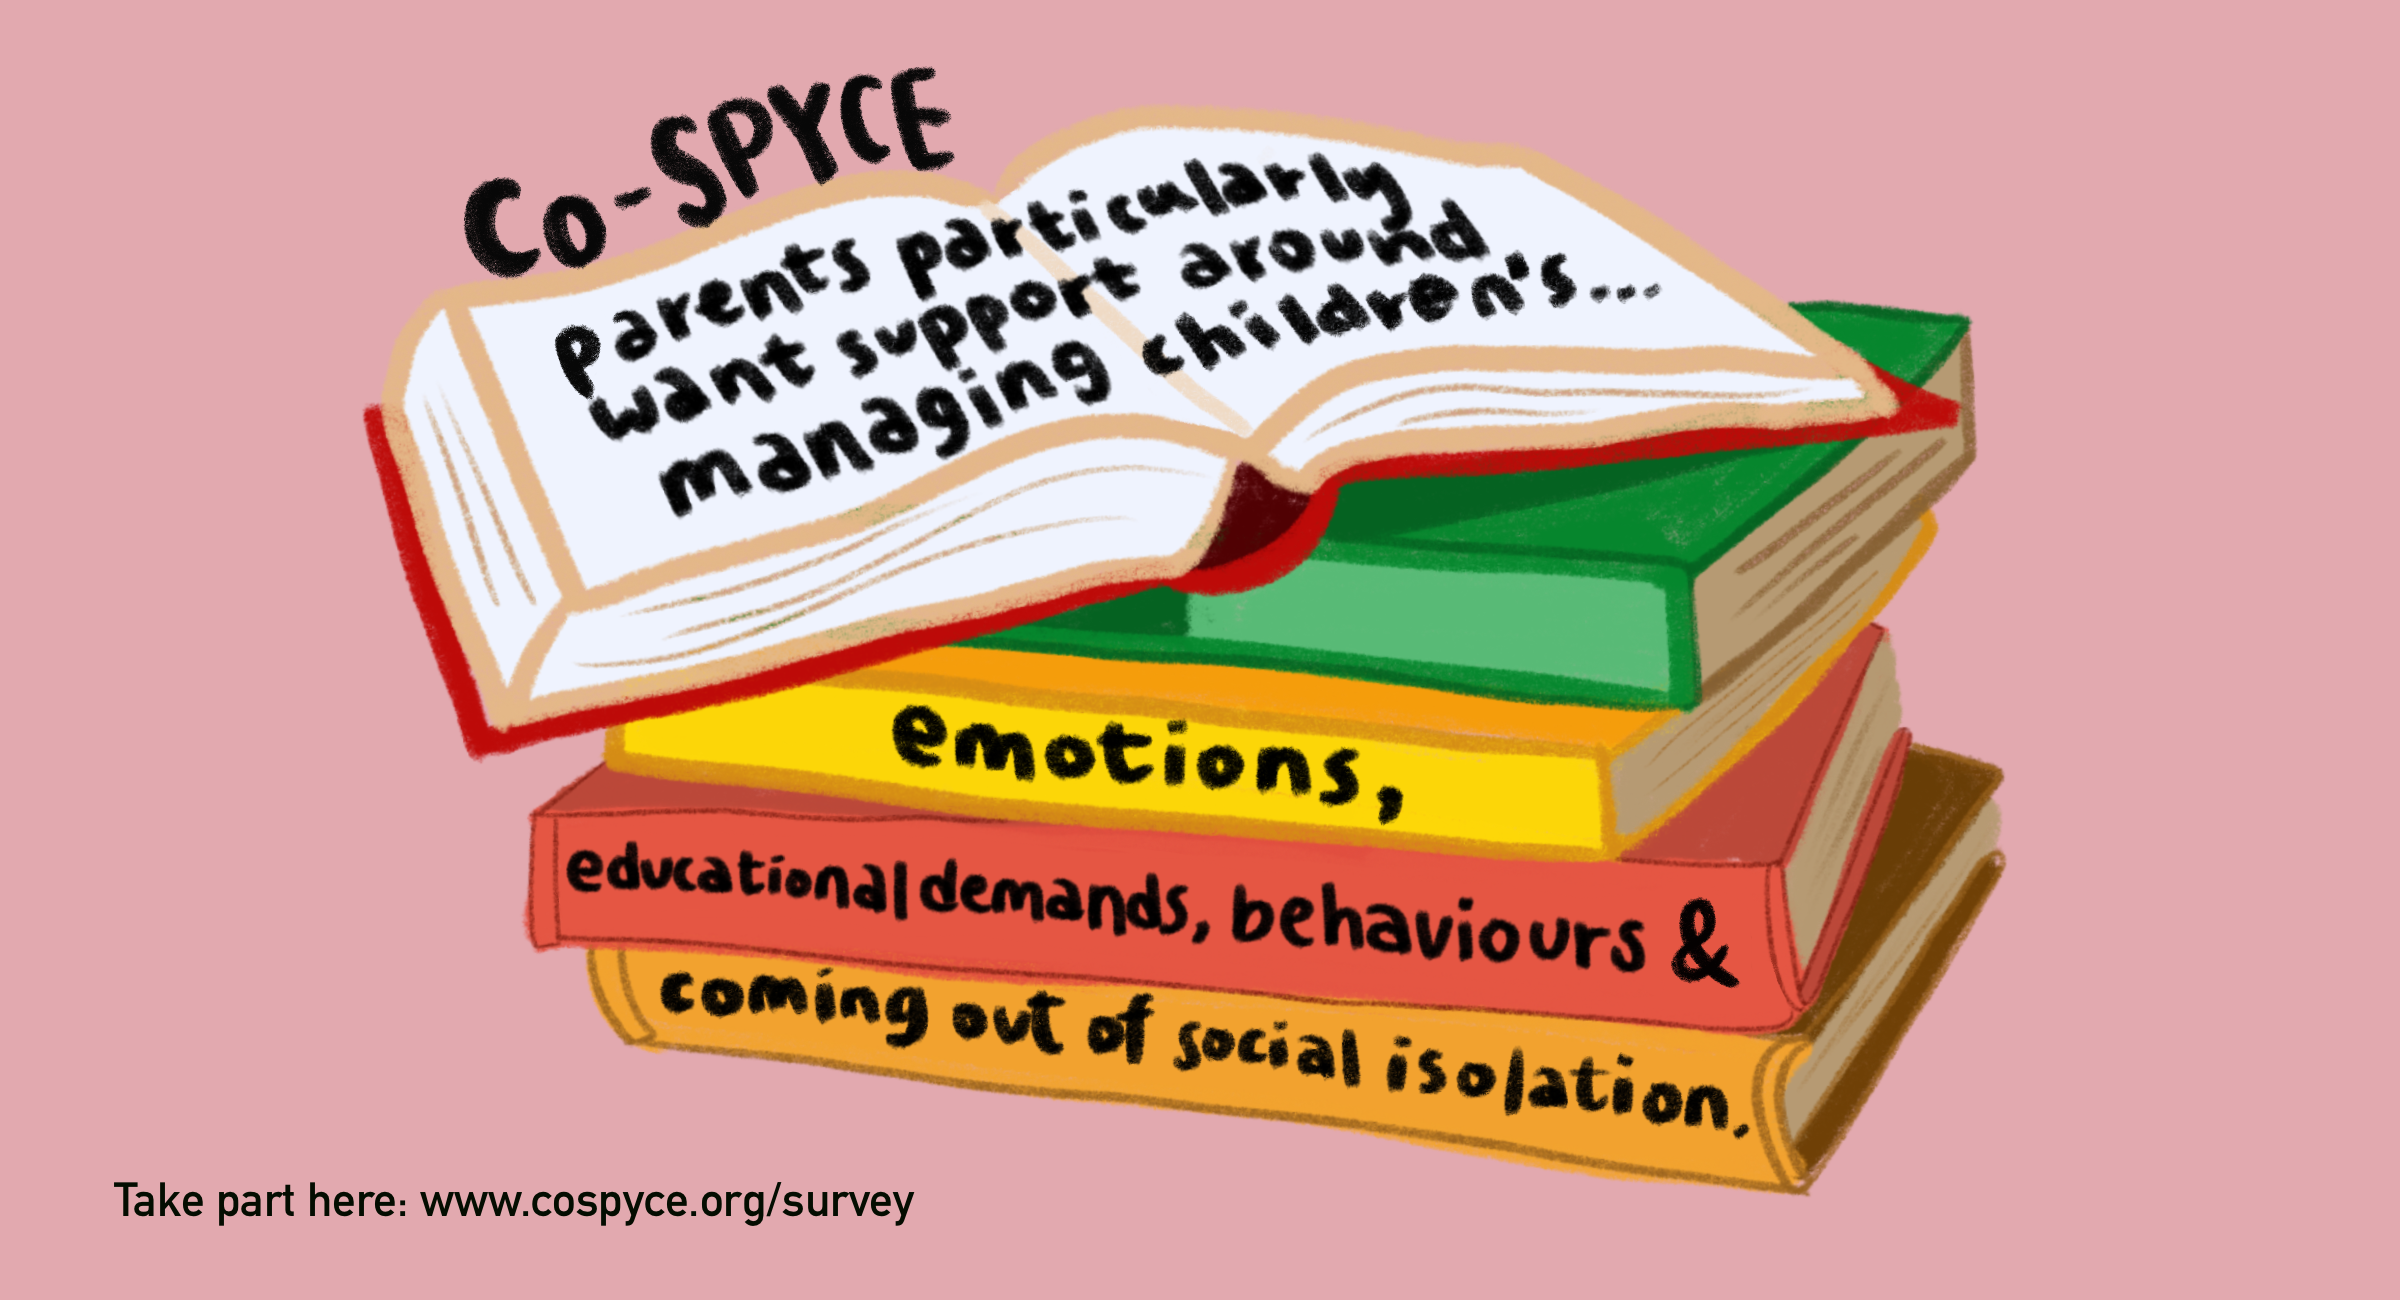
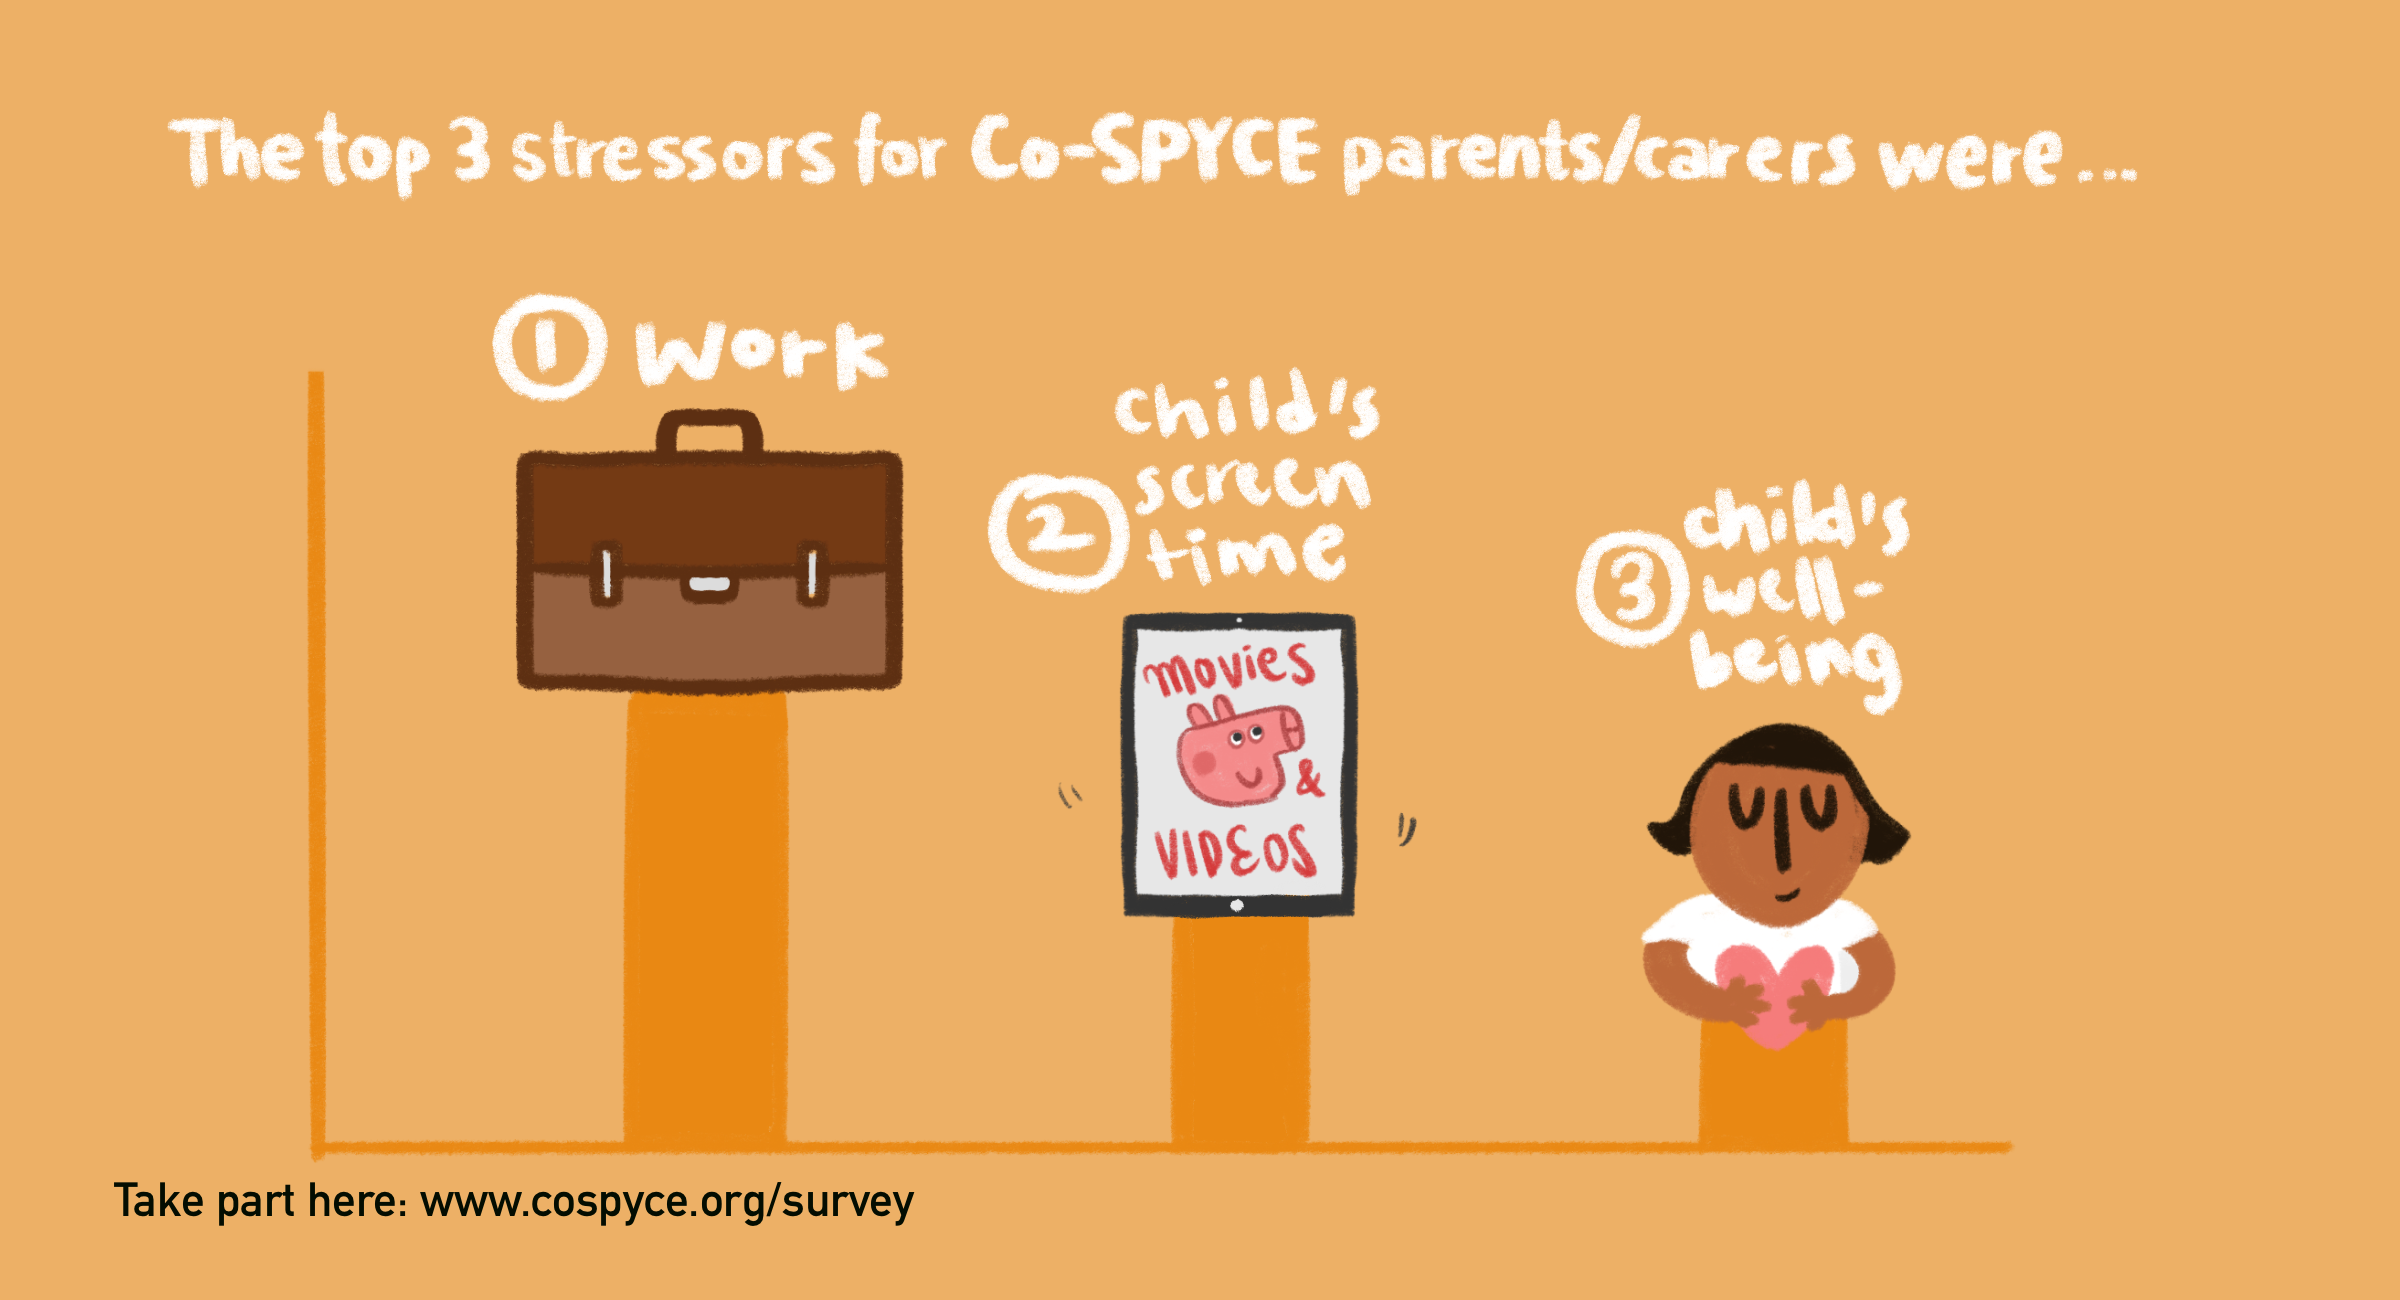
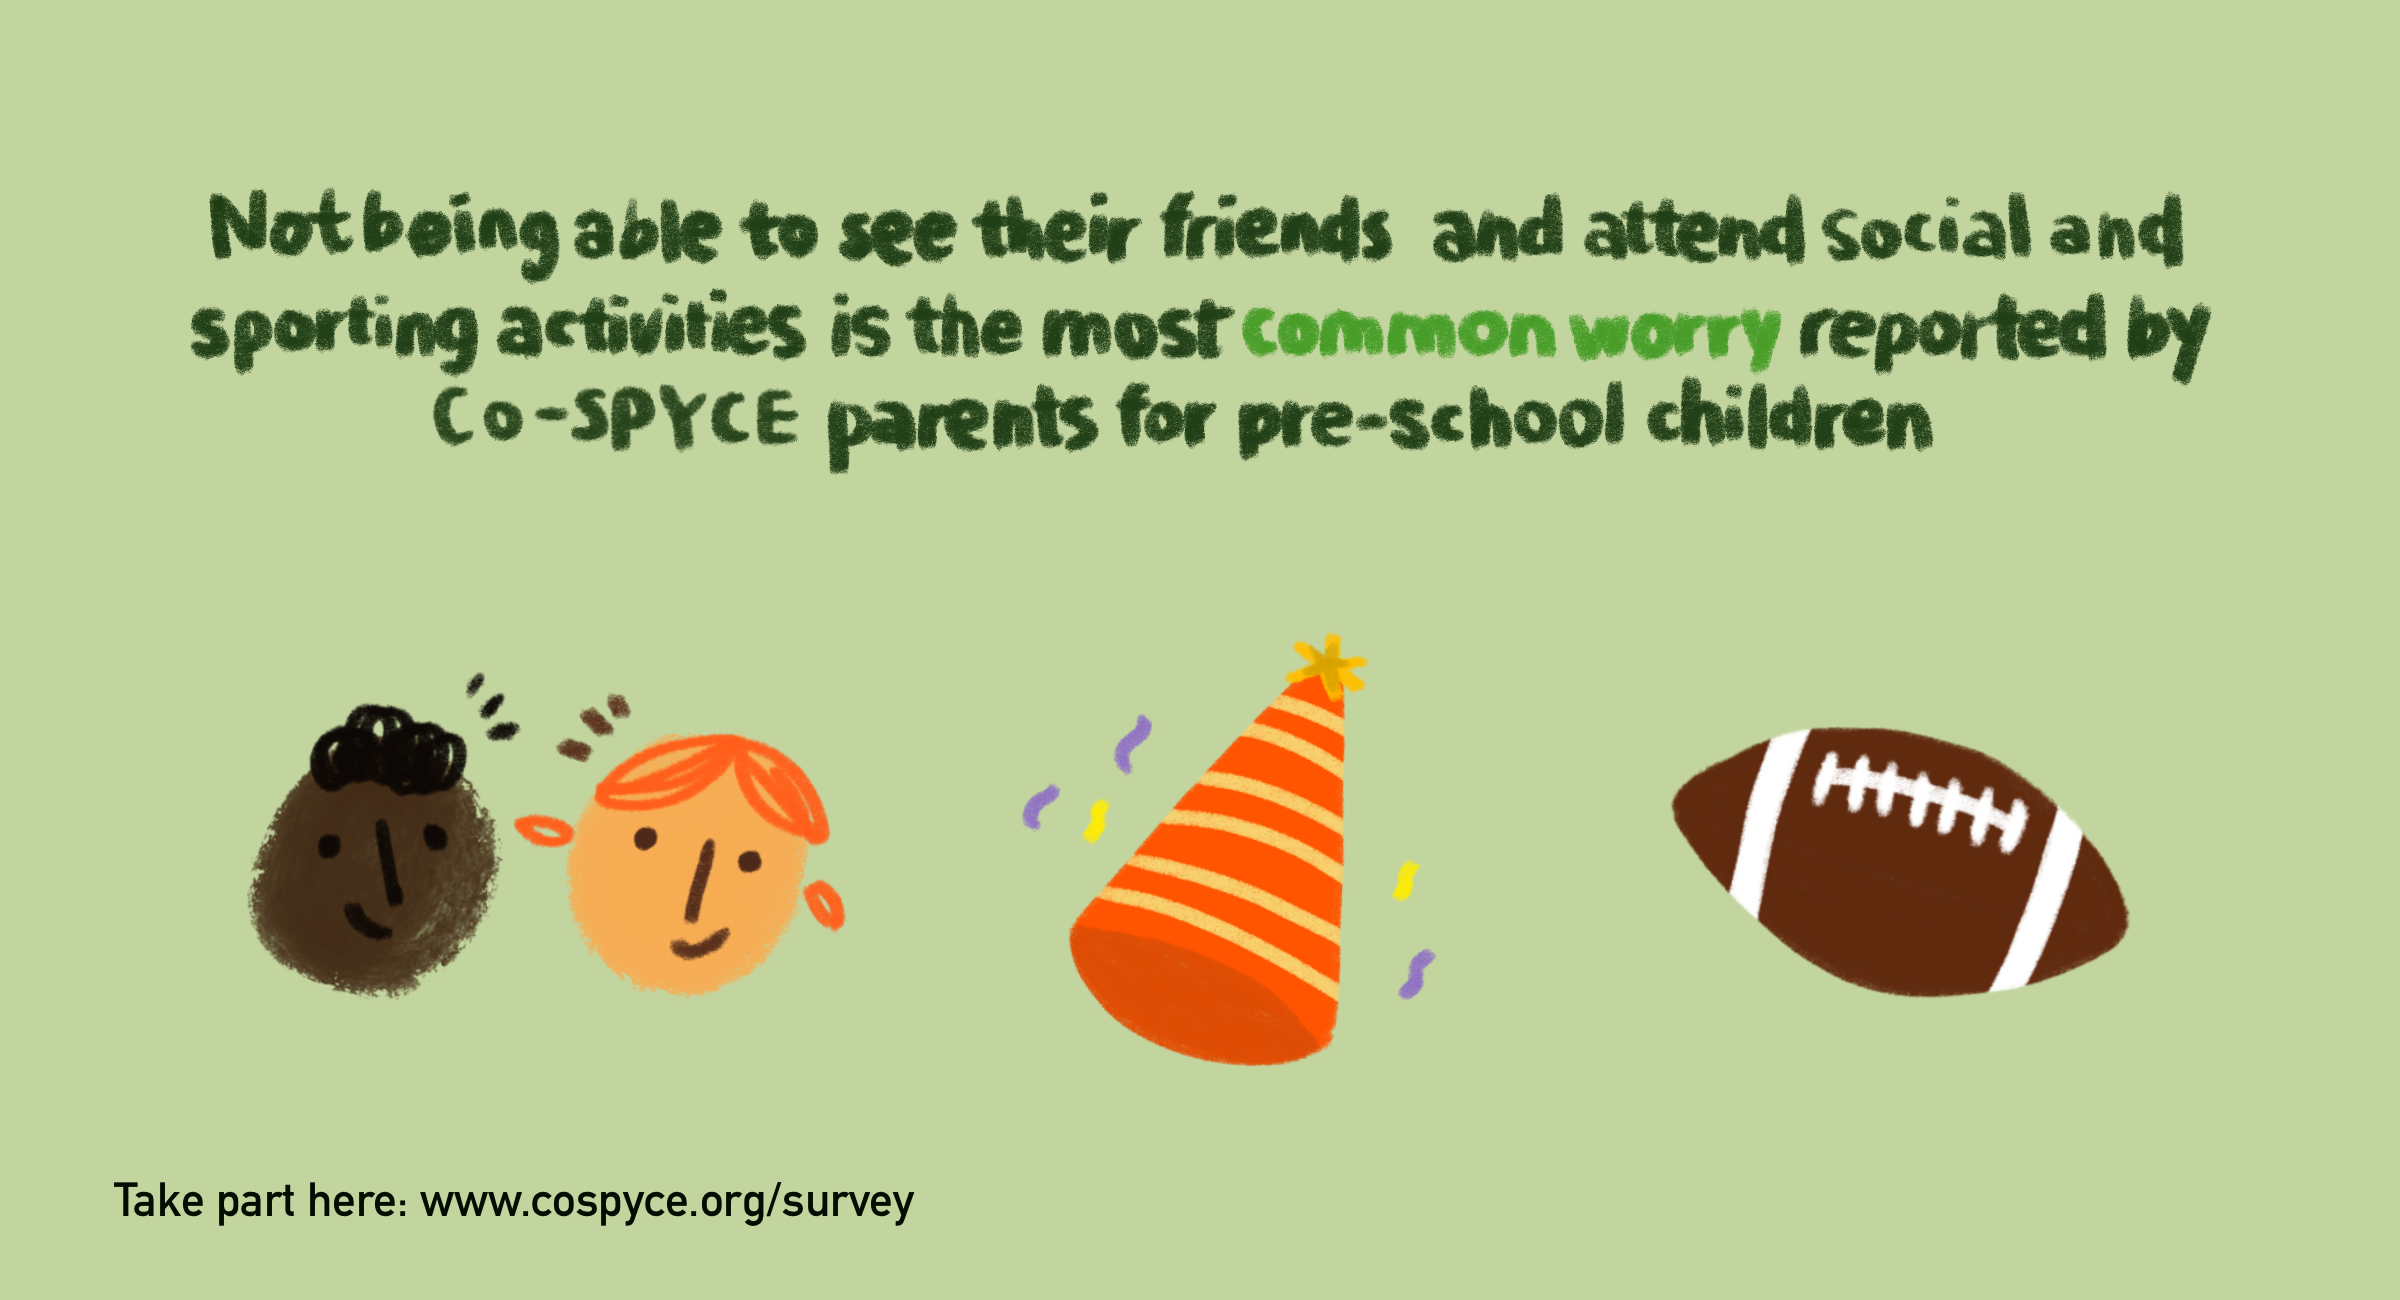
- Visualising data with engaging graphics
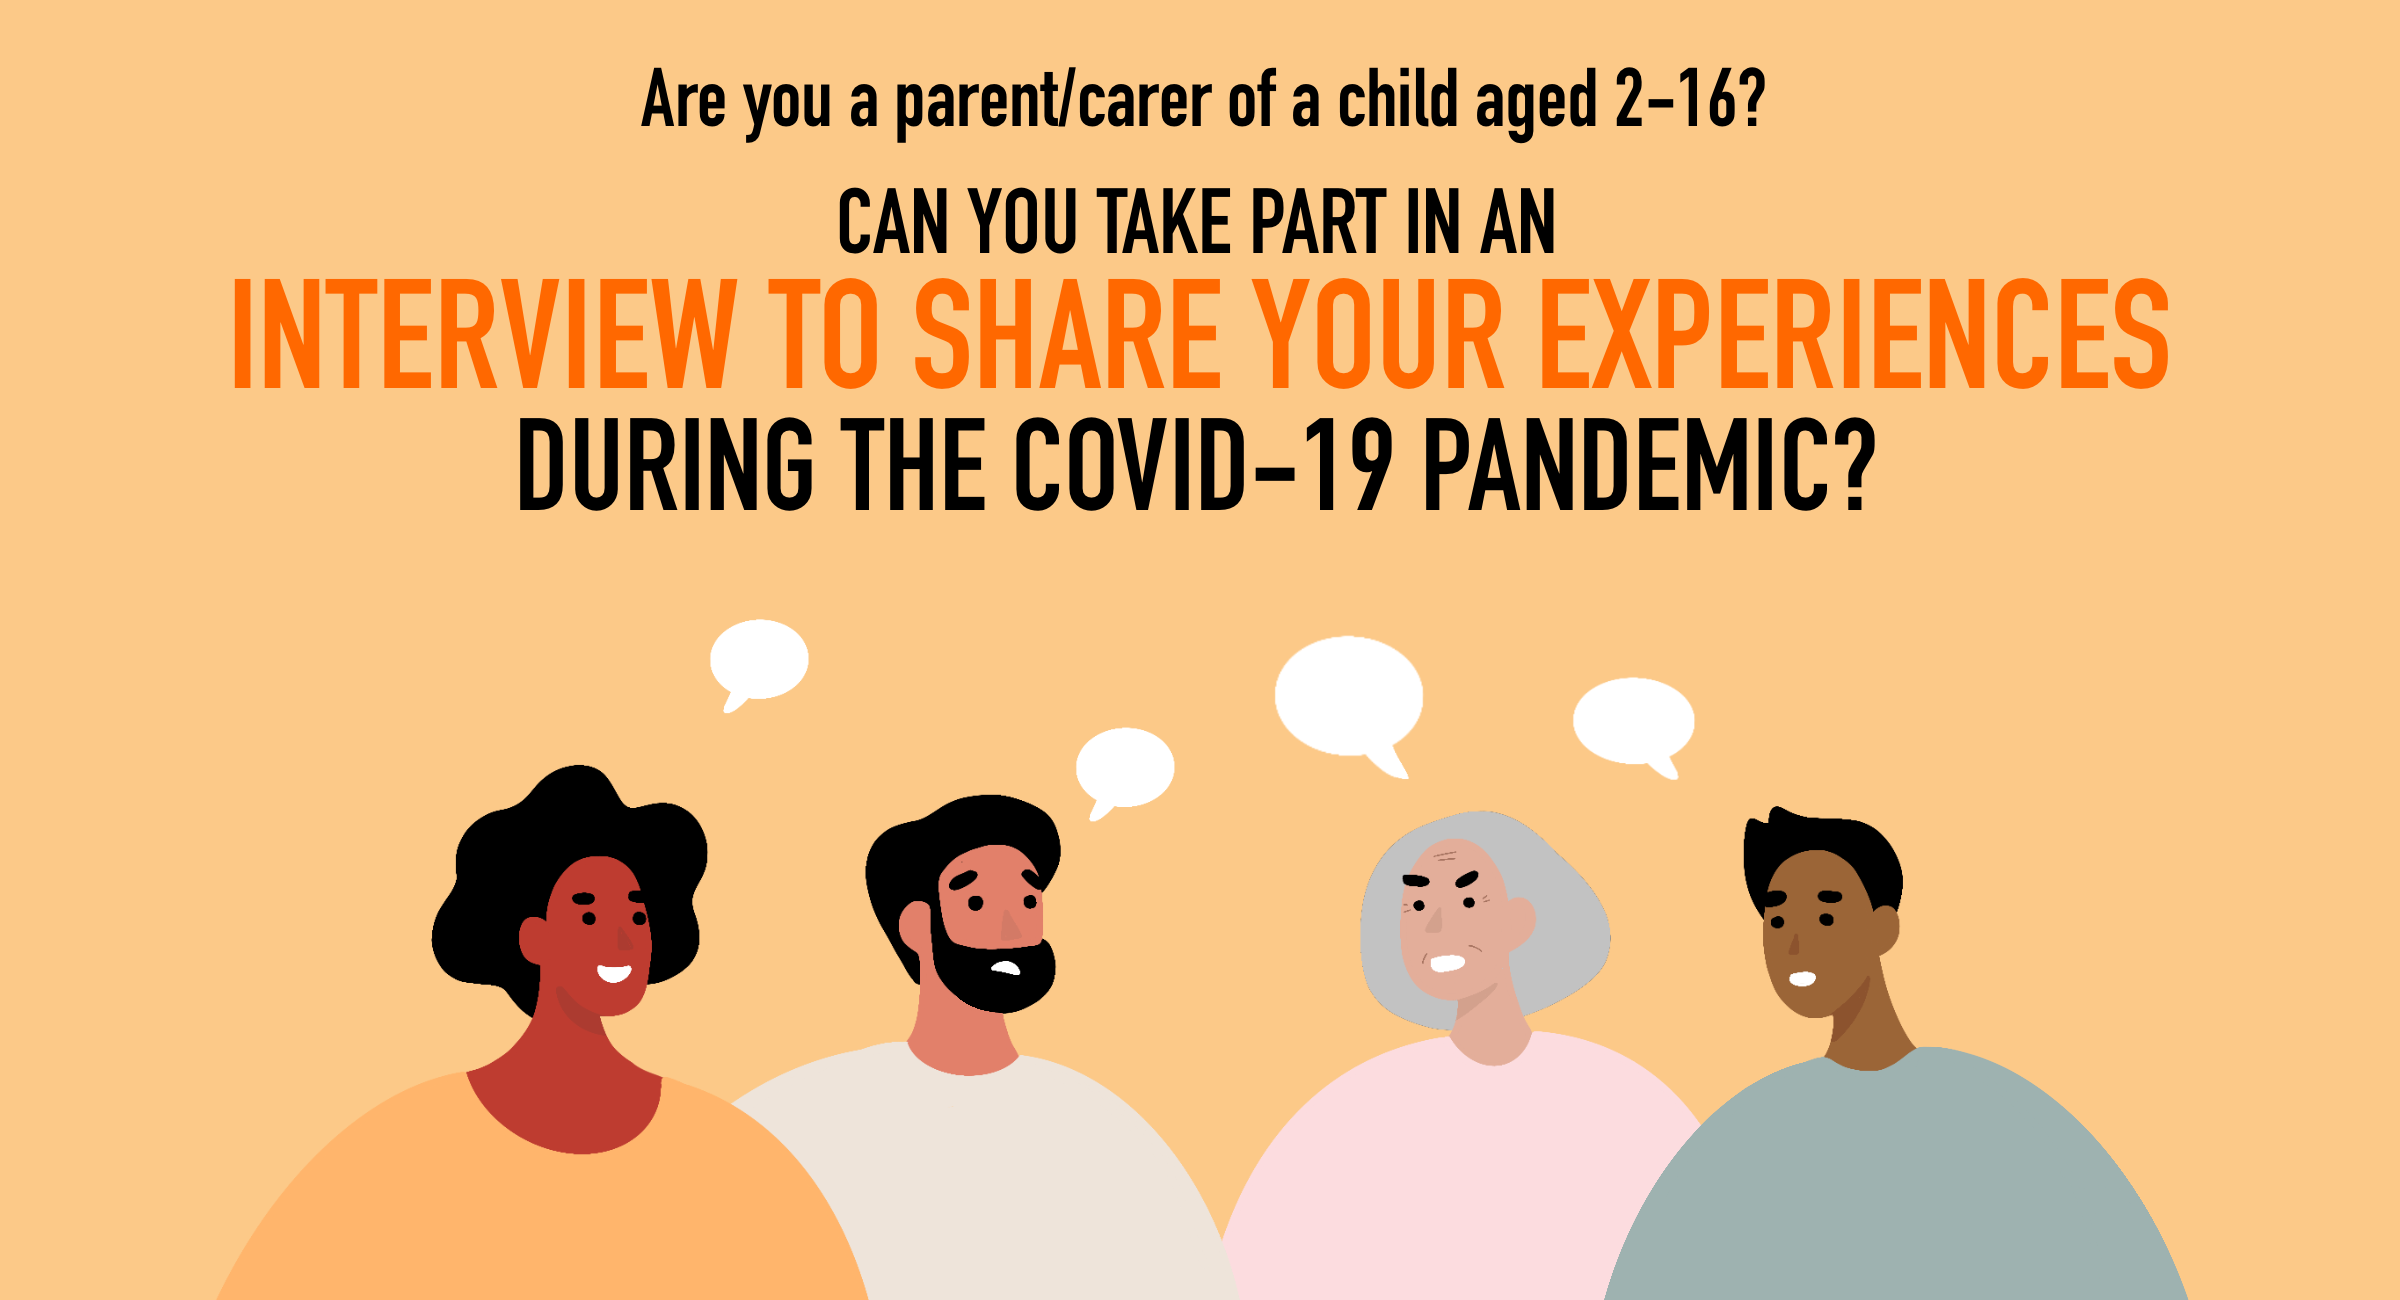
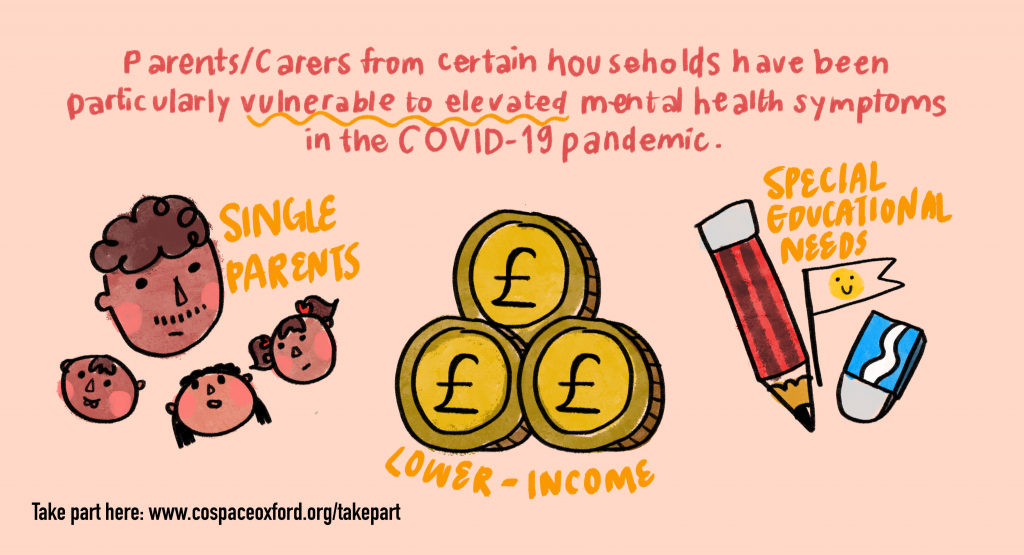
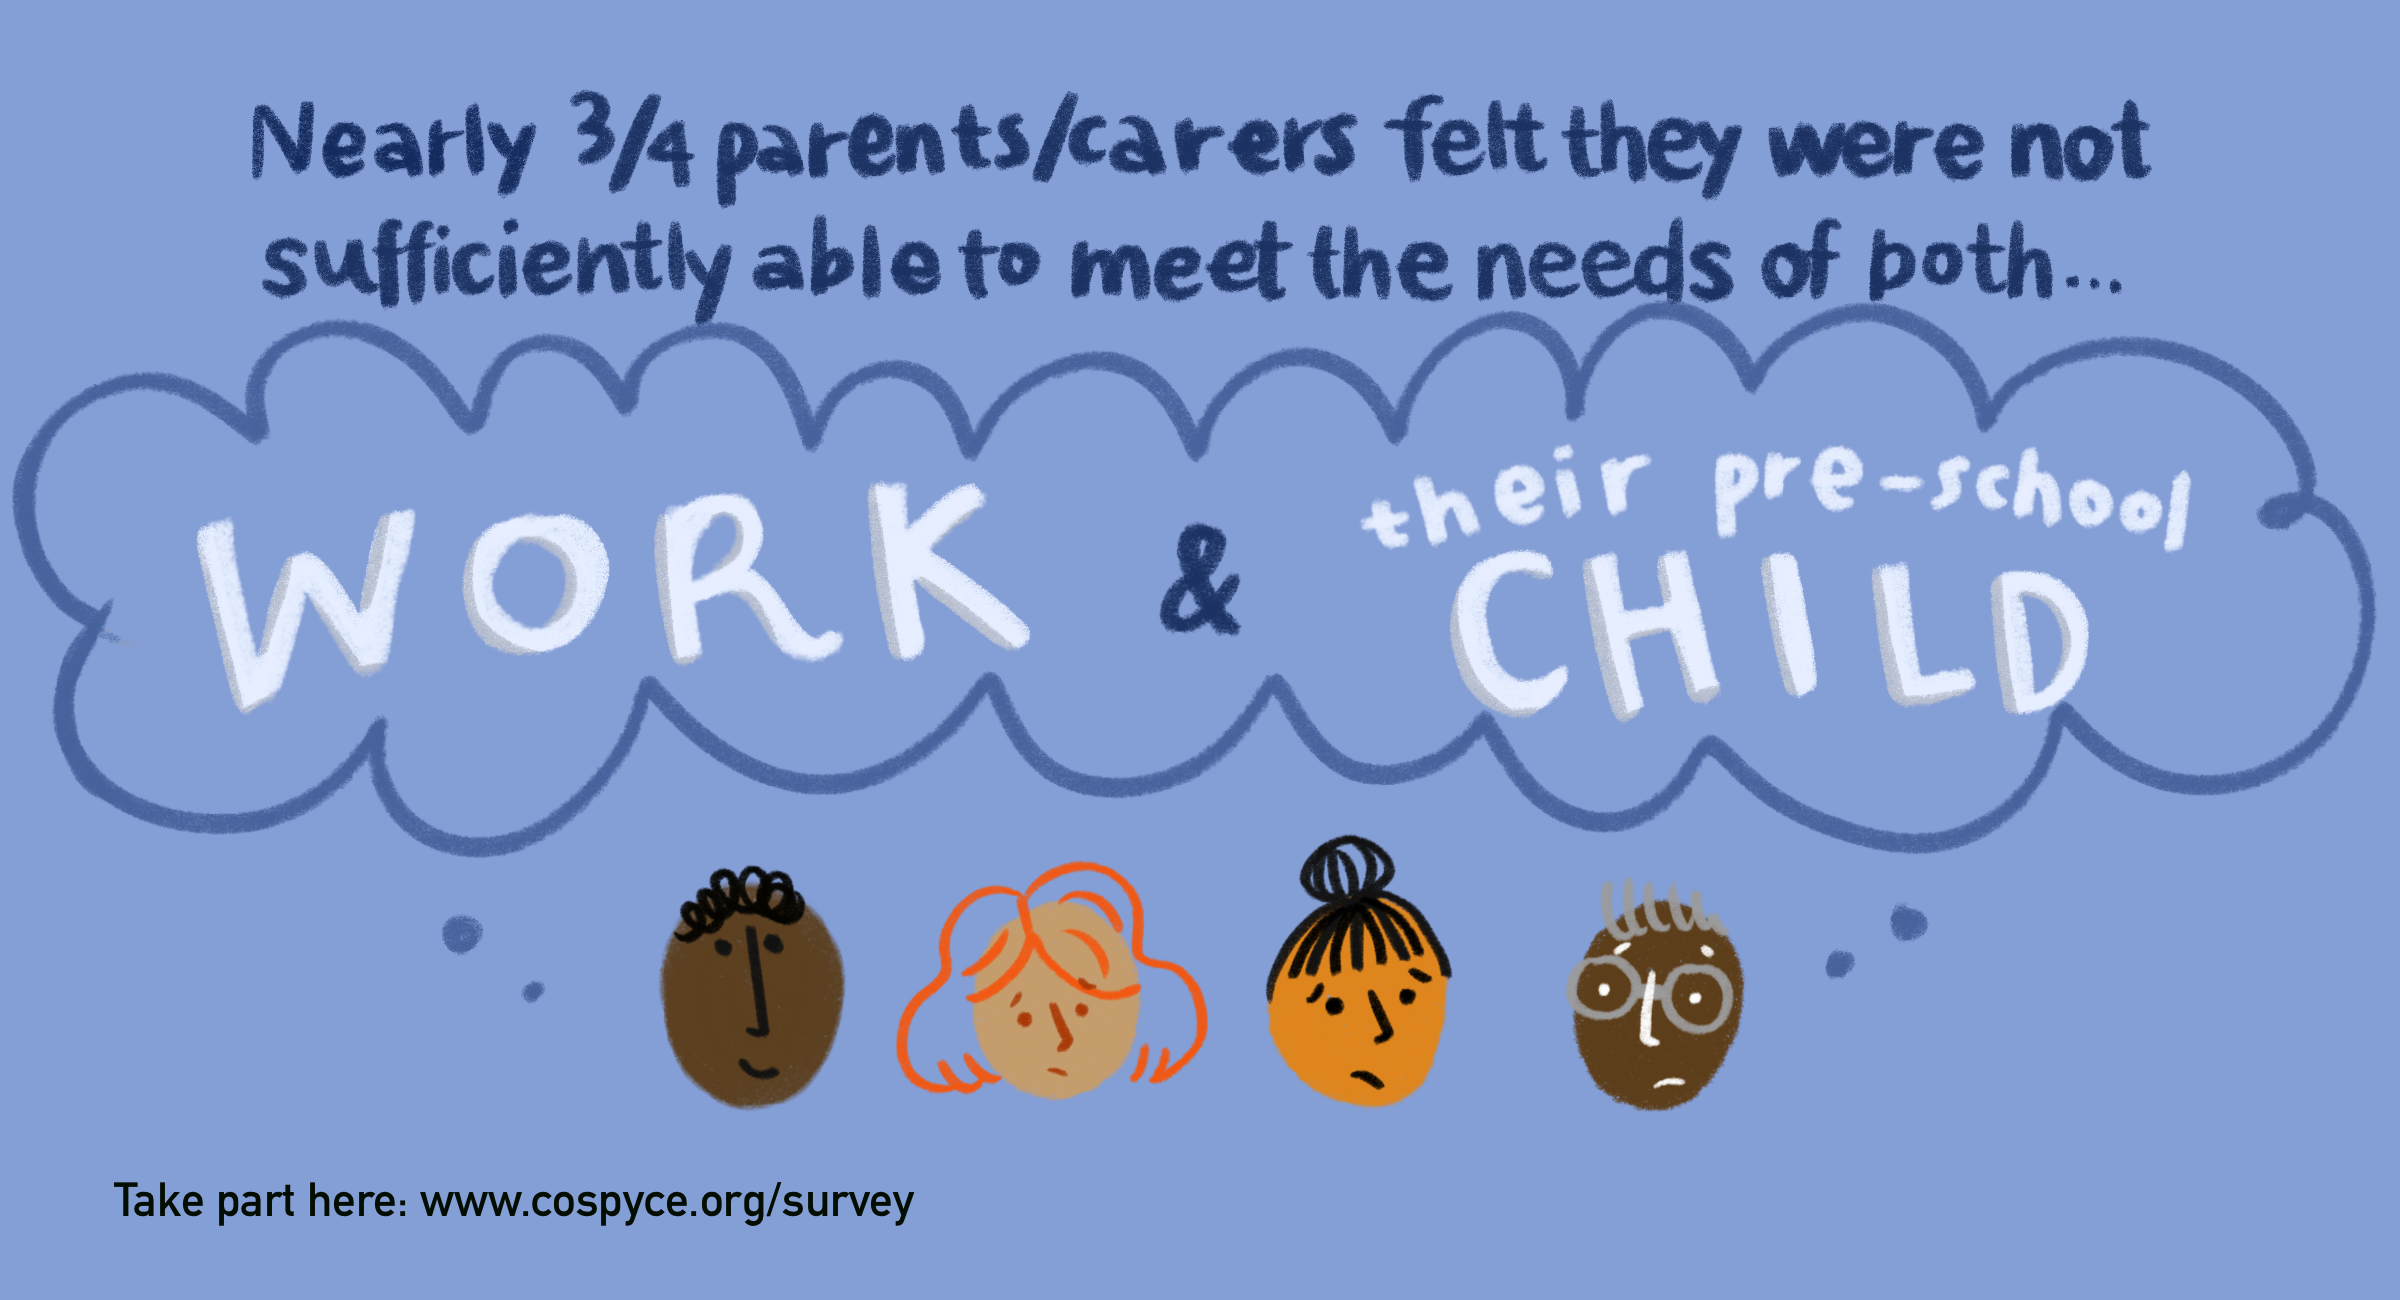
- Increasing participant recruitment by generating social media illustrations
- Creating effective document templates for reports, brochures, flyers, etc